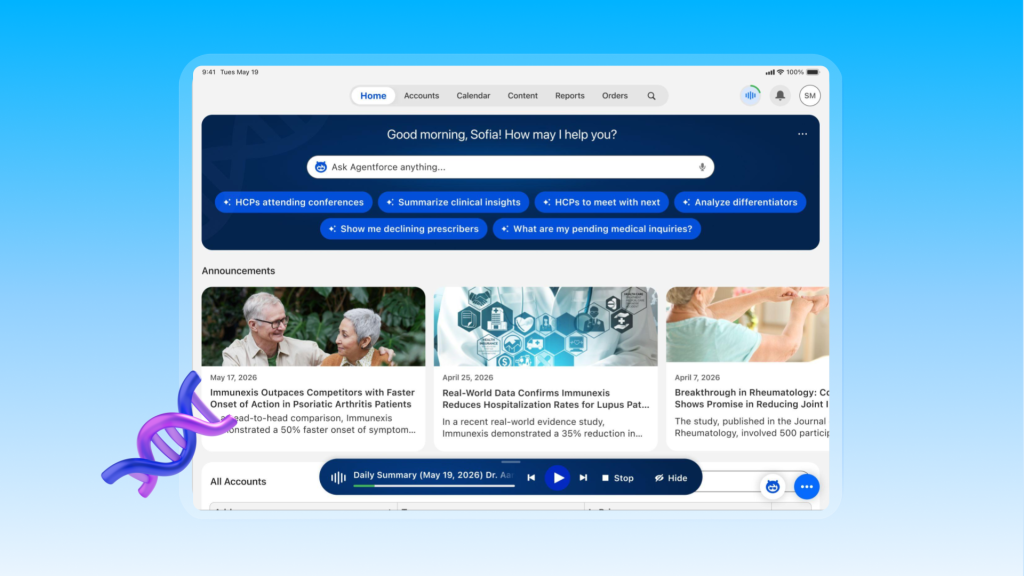
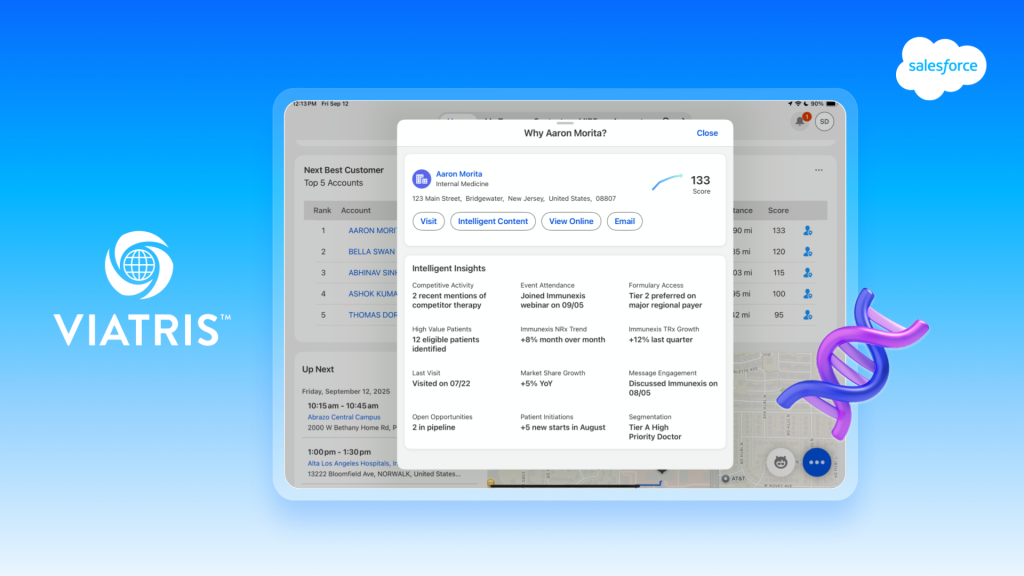
|
First Software-as-a-Service Company to Exceed $500 Million Annual Revenue Run-Rate
- Record Revenue of $130M, up 57% year-over-year
- Net Paying Subscribers Rise a Record 61,000 to 556,000
- Net Customers Rise a Record 2,300 to 27,100
- Operating Cash Flow of $30.6M
- Largest Customer Doubles Deployment to 15,000 Subscribers
- Company Raises Full Year Fiscal 2007 Guidance
- Break-even GAAP EPS
- GAAP EPS was reduced by Approximately $0.06 of Stock-Based Compensation and Amortization of
Purchased Intangibles
SAN FRANCISCO, Nov 15, 2006 /PRNewswire-FirstCall via COMTEX News Network/ -- Salesforce.com
(NYSE: CRM), the market and technology leader in on-demand business services, today announced
results for its fiscal third quarter ended October 31, 2006.
"We had a spectacular quarter," said Marc Benioff, chairman and CEO, salesforce.com. "We have
doubled our largest customer to 15,000 subscribers demonstrating the scalability of the on-demand
model to the world's largest companies."
(Logo: http://www.newscom.com/cgi-bin/prnh/20050216/SFW105LOGO )
Salesforce.com delivered the following results for the third quarter of fiscal year 2007:
Revenue: Total revenue was $130 million, an increase of 57% on a year-over-year basis and an
increase of 10% on a quarter-over-quarter basis. Subscription and support revenues were $118
million, an increase of 59% on a year-over-year basis and an increase of 11% on a
quarter-over-quarter basis. Professional services and other revenues were $12 million, an increase
of 40% on a year-over-year basis and an increase of 1% on a quarter-over-quarter basis.
Earnings per Share: GAAP earnings per share were break-even. This result included
approximately $10.2 million in stock-based compensation and approximately $0.6 million in
amortization of purchased intangibles related to an acquisition. Together, these items reduced
reported GAAP EPS by approximately $0.06 per share. For the basis of GAAP EPS calculations, there
was an average of 120 million diluted shares outstanding during the quarter.
Customers and Paying Subscribers: Customers rose approximately 2,300, a new record, during
the quarter and totaled approximately 27,100, an increase of 45% from Q3 of the prior year, and an
increase of 9% from the prior quarter. Net paying subscribers rose approximately 61,000 during Q3
to exit the quarter at approximately 556,000 total subscribers. This brings total net paying
subscriber additions to 163,000 for the first nine months of fiscal 2007.
Cash: Cash from operations for the fiscal third quarter was approximately $30.6 million, an
increase of 25% year-over-year. Total cash, cash equivalents and marketable securities finished the
quarter at $371 million, up 45% on a year-over-year basis.
Deferred Revenue: Deferred revenue on the balance sheet as of October 31, 2006 was $219
million, an increase of 73% on a year-over-year basis and 8% on a quarter-over-quarter basis.
Based on information as of November 15, 2006, salesforce.com is initiating guidance for its
fourth quarter and raising guidance for its full fiscal year 2007 ending January 31, 2007.
Salesforce.com is also initiating full year fiscal 2008 guidance.
Q4 FY07: Revenue for the company's fourth fiscal quarter is projected to be in the range of
approximately $140 million to approximately $142 million. GAAP diluted EPS is expected to be in the
range of approximately negative ($0.02) to break-even. GAAP EPS estimates include the effects of
stock-based compensation and the amortization of purchased intangibles. For the fourth fiscal
quarter FY07, stock-based compensation expense is expected to be approximately $10 to $12 million,
and the expense associated with the amortization of purchased intangibles is now expected to be
approximately $0.6 million. Together, these items are expected to reduce GAAP earnings per share by
approximately $0.06 to $.07 per share.
Full Year FY07: The company today is raising its revenue outlook for its fiscal year 2007,
and now expects full year revenue of approximately $493 million to approximately $495 million. The
company is also raising its earnings outlook for the full year, and now expects GAAP diluted EPS to
be in the range of approximately negative ($0.02) to breakeven. GAAP EPS estimates include the
effects of stock-based compensation and the amortization of purchased intangibles. For the full
fiscal year '07, stock-based compensation expense is expected to be approximately $38 to $40
million, and the expense associated with the amortization of purchased intangibles is now expected
to be approximately $1.8 million. Together, these items are expected to reduce GAAP earnings per
share by approximately $0.22 to $0.23 per share.
Full Year FY08: The company today is initiating revenue guidance for its fiscal year 2008,
and now expects full year revenue of approximately $700 million to approximately $710 million. The
company plans to provide its expectations for FY08 GAAP EPS on its fourth quarter, FY07 results
conference call planned for mid-February, 2007. GAAP EPS for FY08 is expected to be impacted by the
effects of stock-based compensation and the amortization of purchased intangibles. For the full
fiscal year, stock-based compensation expense is expected to be approximately $60 to $70 million
with an expected reduction in reported GAAP EPS of $0.32 to $0.37. The expense associated with the
amortization of purchased intangibles is now expected to be approximately $2 million, reducing
reported GAAP EPS by approximately $0.01 for the full fiscal year '08.
Quarterly Conference Call
Salesforce.com will host a conference call to discuss its third quarter fiscal 2007 results at
2:00 p.m. Pacific Standard Time today. A live audio webcast of the conference call, together with
detailed financial information, can be accessed through the company's Investor Relations Web site
at http://www.salesforce.com/investor . In addition, an archive of the webcast can be accessed
through the same link. Participants who choose to call into the conference call can do so by
dialing domestically 866-901-SFDC or 866-901-7332 and internationally 706-758-3772. A replay will
be available at 800-642-1687 or 706-645-9291, passcode 1115764, until midnight (EST) December 1,
2006.
About salesforce.com
Salesforce.com is the market and technology leader in on-demand business services. The company's
Salesforce suite of on-demand CRM applications allows customers to manage and share all of their
sales, support, marketing and partner information on-demand. Apex, the world's first on-demand
platform, enables customers, developers and partners to build powerful new on-demand applications
that extend beyond CRM to deliver the benefits of multi-tenancy and The Business Web across the
enterprise. All Apex components and applications can be easily shared, exchanged and installed via
salesforce.com's AppExchange directory, available at http://www.salesforce.com/appexchange .
Customers can also take advantage of Successforce, salesforce.com's world-class training, support,
consulting and best practices offerings.
As of October 31, 2006, salesforce.com manages customer information for approximately 27,100
customers and approximately 556,000 paying subscribers including Advanced Micro Devices (AMD),
America Online (AOL), Avis Budget Group, Inc, Dow Jones Newswires, Nokia, Polycom and SunTrust
Banks. Any unreleased services or features referenced in this or other press releases or public
statements are not currently available and may not be delivered on time or at all. Customers who
purchase salesforce.com applications should make their purchase decisions based upon features that
are currently available. Salesforce.com has headquarters in San Francisco, with offices in Europe
and Asia, and trades on the New York Stock Exchange under the ticker symbol "CRM." For more
information please visit http://www.salesforce.com , or call 1-800-NO-SOFTWARE.
"Safe harbor" statement under the Private Securities Litigation Reform Act of 1995: This press
release contains forward-looking statements about expected revenue and GAAP earnings per share for
the fourth fiscal quarter of 2007, the full fiscal year 2007, the full fiscal year 2008, related
items, and our revenue run rate and future revenue goals, and acceptance of the Apex platform, the
achievement of which involve risks, uncertainties and assumptions. If any such risks or
uncertainties materialize or if any of the assumptions proves incorrect, our results could differ
materially from the results expressed or implied by the forward-looking statements we make.
The risks and uncertainties referred to above include -- but are not limited to -- risks
associated with possible fluctuations in our operating results, rate of growth and anticipated
revenue run rate, errors, interruptions or delays in our service or our Web hosting, our new
business model, our history of operating losses, the possibility that we will not remain
profitable, breach of our security measures, the emerging market in which we operate, our
relatively limited operating history, our ability to hire, retain and motivate our employees and
manage our growth, competition, our ability to continue to release and gain customer acceptance of
new and improved versions of our service, customer and partner acceptance of the Apex platform and
the AppExchange, successful customer deployment and utilization of our services, unanticipated
changes in our effective tax rate, fluctuations in the number of shares outstanding, the price of
such shares, foreign currency exchange rates and interest rates.
Further information on these and other factors that could affect our financial results is
included in the reports on Forms 10-K, 10-Q and 8-K and in other filings we make with the
Securities and Exchange Commission from time to time, including Form 10-Q for the quarter ended
July 31, 2006, and our Form 10-K for the fiscal year ended January 31, 2006. These documents are
available on the SEC Filings section of the Investor Information section of our website at
www.salesforce.com/investor .
Salesforce.com, inc. assumes no obligation and does not intend to update these forward-looking
statements, except as required by law.
NOTE: Salesforce.com is a registered trademark of, AppExchange and Successforce are trademarks
of, salesforce.com, Inc., San Francisco, California. Other names used may be trademarks of their
respective owners.
salesforce.com, inc.
Condensed Consolidated Statements of Operations
(in thousands, except per share data)
(Unaudited)
Three Months Ended Nine Months Ended
Oct 31, Oct 31,
2006 2005 2006 2005
Revenues:
Subscription and support $118,433 $74,386 $319,589 $198,214
Professional services and other 11,620 8,287 33,287 20,579
Total revenues 130,053 82,673 352,876 218,793
Cost of revenues (1):
Subscription and support 16,628 10,069 45,178 23,418
Professional services and other 14,732 9,515 39,873 24,368
Total cost of revenues 31,360 19,584 85,051 47,786
Gross profit 98,693 63,089 267,825 171,007
Operating expenses (1):
Research and development 11,450 6,602 31,283 16,374
Marketing and sales 66,526 37,905 178,353 107,095
General and administrative 20,840 12,195 59,711 32,973
Lease recovery 0 0 0 (285)
Total operating expenses 98,816 56,702 269,347 156,157
Income (loss) from operations (123) 6,387 (1,522) 14,850
Interest, net 4,132 2,024 10,281 5,158
Other income (expense) 309 (74) (153) 636
Income before (provision) benefit
for income taxes and minority
interest 4,318 8,337 8,606 20,644
(Provision) benefit for income
taxes (3,418) 5,101 (7,136) 2,640
Income before minority interest 900 13,438 1,470 23,284
Minority interest in consolidated
joint venture (561) (341) (1,505) (767)
Net income (loss) $339 $13,097 ($35) $22,517
Basic net income (loss) per share $0.00 $0.12 $0.00 $0.21
Diluted net income (loss) per
share $0.00 $0.11 $0.00 $0.19
Shares used in computing basic net
income (loss) per share 112,885 107,781 111,889 106,547
Shares used in computing diluted
net income (loss) per share 120,279 118,655 111,889 117,764
(1) Amounts include stock-based
expenses, as follows:
Cost of revenues $1,304 $135 $3,900 $445
Research and development 1,195 77 3,201 256
Marketing and sales 4,826 301 13,026 1,028
General and administrative 2,915 312 7,912 890
Total stock-based
expenses $10,240 $825 $28,039 $2,619
salesforce.com, inc.
Condensed Consolidated Statements of Operations
As a percentage of total revenues:
(Unaudited)
Three Months Ended Nine Months Ended
Oct 31, Oct 31,
2006 2005 2006 2005
Revenues:
Subscription and support 91% 90% 91% 91%
Professional services and other 9 10 9 9
Total revenues 100 100 100 100
Cost of revenues:
Subscription and support 13 12 13 11
Professional services and other 11 12 11 11
Total cost of revenues 24 24 24 22
Gross profit 76 76 76 78
Operating expenses:
Research and development 9 7 9 7
Marketing and sales 51 46 51 49
General and administrative 16 15 16 15
Lease recovery 0 0 0 0
Total operating expenses 76 68 76 71
Income (loss) from operations 0 8 0 7
Interest, net 3 2 3 2
Other income (expense) 0 0 0 0
Income before (provision) benefit for
income taxes and minority interest 3 10 3 9
(Provision) benefit for income taxes (3) 6 (3) 2
Income before minority interest 0 16 0 11
Minority interest in consolidated
joint venture 0 0 0 (1)
Net income (loss) 0% 16% 0% 10%
Stock-based expenses as a percentage
of total revenues, as follows:
Cost of revenues 1% 0% 1% 0%
Research and development 1 0 1 0
Marketing and sales 4 0 4 1
General and administrative 2 1 2 0
Total stock-based
expenses 8% 1% 8% 1%
salesforce.com, inc.
Condensed Consolidated Balance Sheets
(in thousands)
Oct 31, January 31,
2006 2006
(unaudited)
Assets
Current assets:
Cash and cash equivalents $70,324 $99,842
Short-term marketable securities 174,574 107,723
Accounts receivable, net 82,808 76,128
Deferred commissions 15,479 13,186
Prepaid expenses and other
current assets 12,749 6,338
Total current assets 355,934 303,217
Marketable securities, noncurrent 126,380 89,227
Fixed assets, net 28,151 24,216
Deferred commissions, noncurrent 5,319 3,889
Deferred income taxes, noncurrent 20,850 10,416
Goodwill 6,743 0
Other assets 12,312 3,784
Total assets $555,689 $434,749
Liabilities and stockholders' equity
Current liabilities:
Accounts payable $5,660 $10,212
Accrued expenses and other
current liabilities 59,025 48,782
Income taxes payable 4,207 2,650
Deferred income taxes 5,637 3,191
Deferred revenue 219,431 169,175
Current portion of capital lease
obligations 327 615
Total current liabilities 294,287 234,625
Capital lease obligations, net of
current portion 13 184
Long-term lease abandonment
liability and other 1,089 1,155
Minority interest 3,919 2,414
Total liabilities 299,308 238,378
Stockholders' equity:
Common stock 114 111
Additional paid-in capital 294,365 237,010
Deferred stock-based compensation 0 (2,531)
Accumulated other comprehensive
loss (1,949) (2,105)
Accumulated deficit (36,149) (36,114)
Total stockholders' equity 256,381 196,371
Total liabilities and stockholders'
equity $555,689 $434,749
salesforce.com, inc.
Condensed Consolidated Statements of Cash Flows
(in thousands)
(Unaudited)
Three Months Ended Nine Months Ended
Oct 31, Oct 31,
2006 2005 2006 2005
Operating activities:
Net income (loss) $339 $13,097 ($35) $22,517
Adjustments to reconcile net
income (loss) to net
cash provided by operating
activities:
Minority interest 561 341 1,505 767
Depreciation and amortization 3,339 1,490 8,767 4,079
Amortization of deferred
commissions 5,827 3,629 16,605 10,357
Lease recovery 0 0 0 (285)
Expenses related to stock-based
awards 10,240 825 28,039 2,619
Tax benefits from employee
stock plans (4,878) 794 (10,806) 2,712
Changes in assets and
liabilities 15,199 4,395 28,990 13,787
Net cash provided by
operating activities 30,627 24,571 73,065 56,553
Investing activities:
Business combination 0 0 (15,502) 0
Restricted cash 0 3,307 0 3,191
Changes in marketable securities (116,209) 37,750 (103,152) (283)
Capital expenditures (9,085) (5,291) (14,498) (17,820)
Net cash provided by (used
in) investing activities (125,294) 35,766 (133,152) (14,912)
Financing activities:
Proceeds from the exercise of
stock options and warrants 10,149 2,209 21,040 9,651
Tax benefits from employee stock
plans 4,878 0 10,806 0
Collection of notes receivables 0 0 0 727
Principal payments on capital
lease obligations (155) (152) (459) (463)
Repurchase of unvested shares 0 0 (10) (28)
Net cash provided by
financing activities 14,872 2,057 31,377 9,887
Effect of exchange rate changes 127 (179) (808) 96
Net increase (decrease) in cash
and cash equivalents (79,668) 62,215 (29,518) 51,624
Cash and cash equivalents,
beginning of period 149,992 25,140 99,842 35,731
Cash and cash equivalents, end of
period $70,324 $87,355 $70,324 $87,355
salesforce.com, inc.
Additional Metrics
(Unaudited)
Oct 31, July 31, April 30,
2006 2006 2006
Customer and subscriber data:
Approximate number of customers 27,100 24,800 22,700
Approximate number of paying
subscriptions (1) 556,000 495,000 438,000
Full Time Equivalent Headcount 1,807 1,625 1,480
Financial data (in thousands):
Cash, cash equivalents and
marketable
securities $371,278 $334,107 $298,313
Deferred revenue $219,431 $202,836 $182,036
January 31, October 31, July 31,
2006 2005 2005
Customer and subscriber data:
Approximate number of customers 20,500 18,700 16,900
Approximate number of paying
subscriptions (1) 393,000 347,000 307,000
Full Time Equivalent Headcount 1,304 1,116 1,059
Financial data (in thousands):
Cash, cash equivalents and
marketable
securities $296,792 $256,853 $232,710
Deferred revenue $169,175 $127,110 $117,311
Revenues by geography (in thousands):
Three Months Ended Nine Months Ended
Oct 31, Oct 31,
2006 2005 2006 2005
Americas $101,240 $66,021 $276,818 $174,622
Europe 19,821 11,356 52,395 30,777
Asia Pacific 8,992 5,296 23,663 13,394
$130,053 $82,673 $352,876 $218,793
As a percentage of total
revenues:
Americas 78% 80% 78% 80%
Europe 15 14 15 14
Asia Pacific 7 6 7 6
100% 100% 100% 100%
(1) Paying subscriptions are defined as unique user accounts, purchased by customers for use by
their employees and other customer-authorized users that have not been suspended for non-payment
and for which we are recognizing subscription revenue. The numbers of paying subscriptions were
revised as follows for the correction of an error.
Previously
As of Reported Adjusted
July 31, 2005 308,000 307,000
October 31, 2005 351,000 347,000
January 31, 2006 399,000 393,000
April 30, 2006 444,000 438,000
July 31, 2006 501,000 495,000
SOURCE salesforce.com, Inc.
Investor Relations, David Havlek, +1-415-536-2171, or dhavlek@salesforce.com, or
Public Relations, Bruce Francis, +1-415-536-6972, or bfrancis@salesforce.com, both of
salesforce.com
http://www.salesforce.com/
|