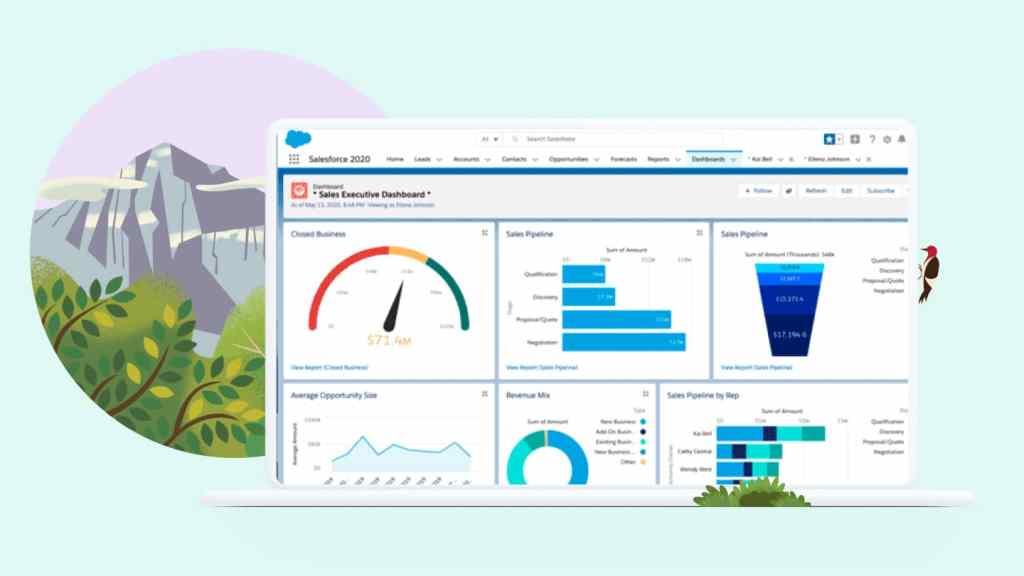
Sales teams track their personal quota, their team quote, forecast gaps, and likely deals in their pipeline in a dashboard.

Sales Analytics

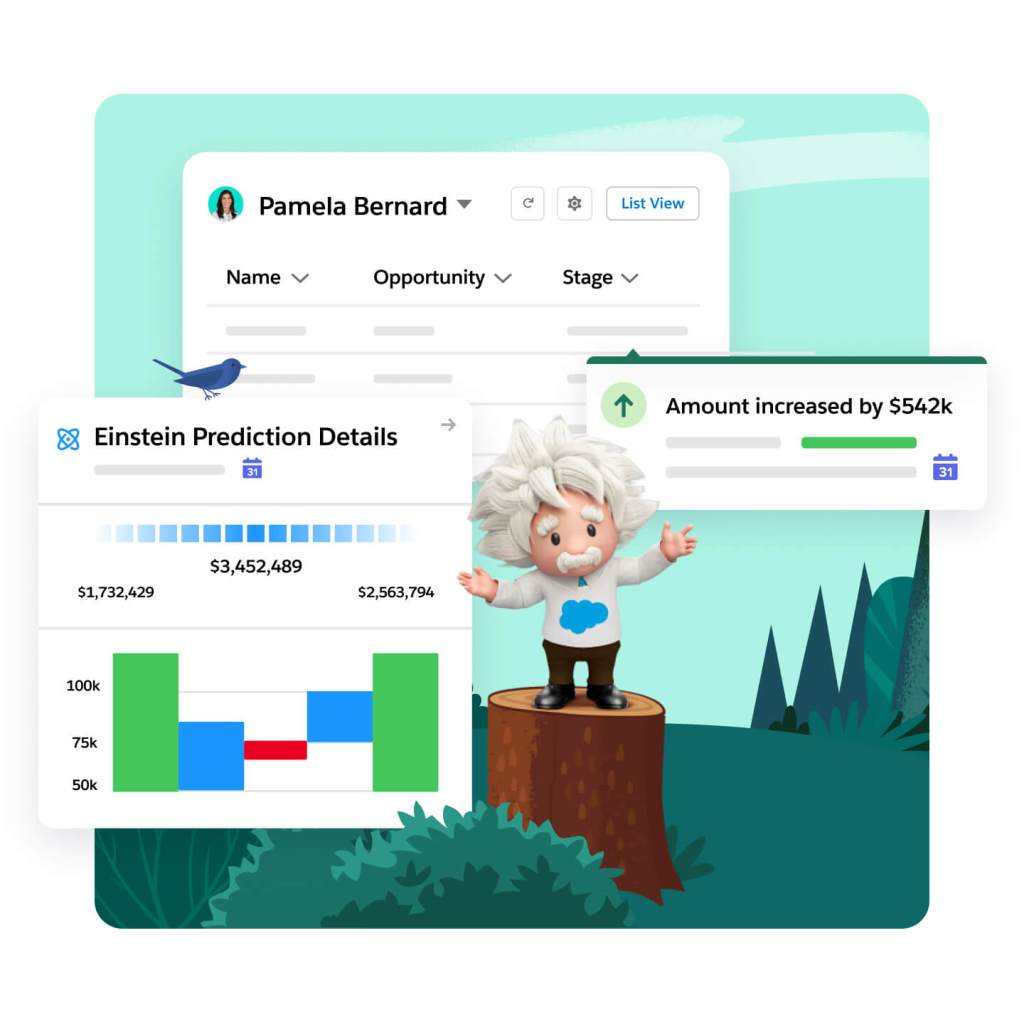
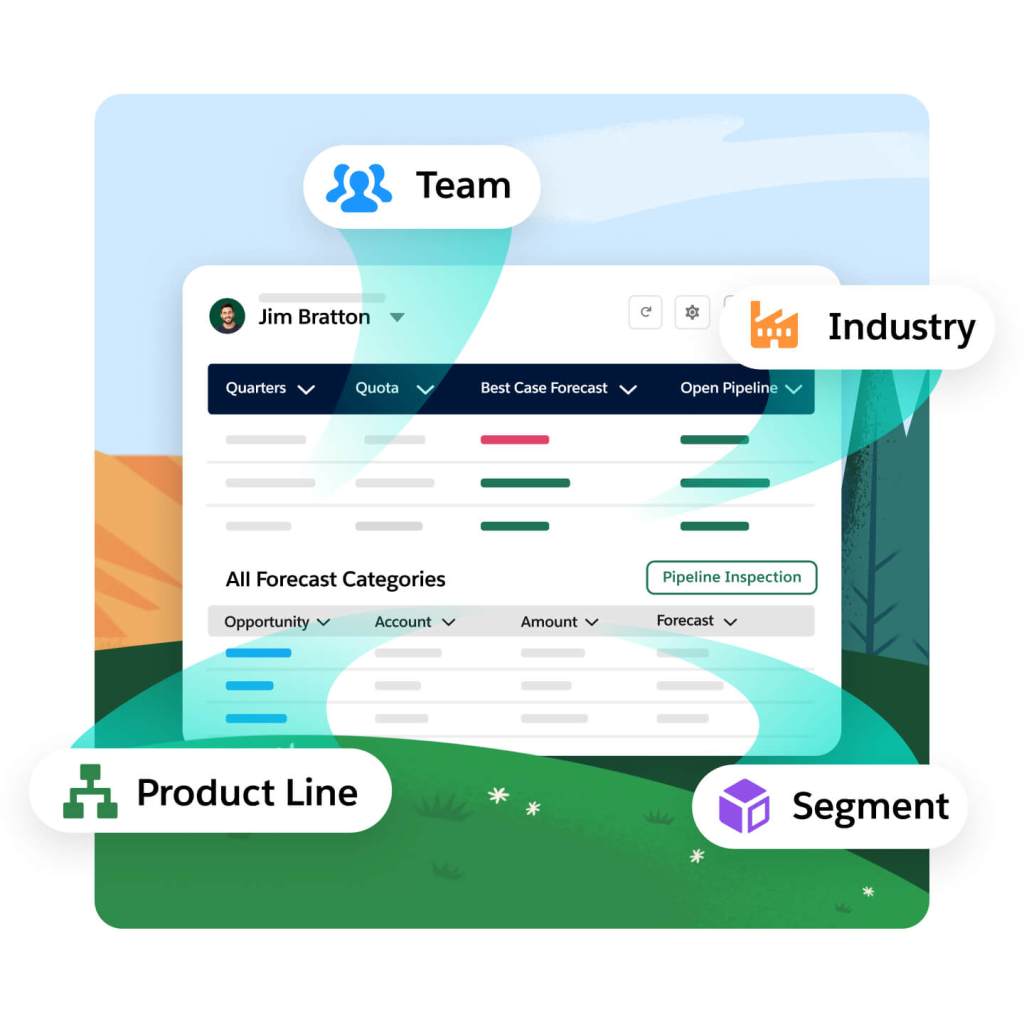
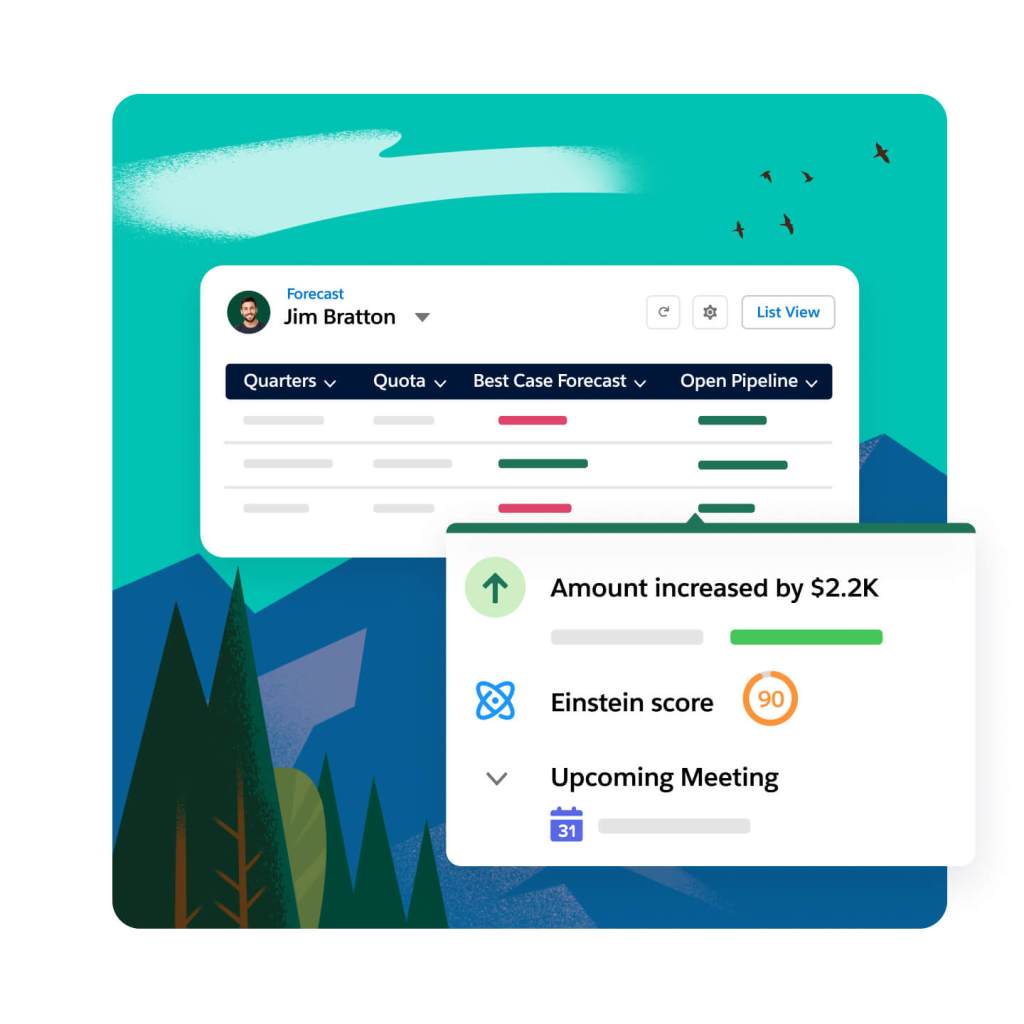
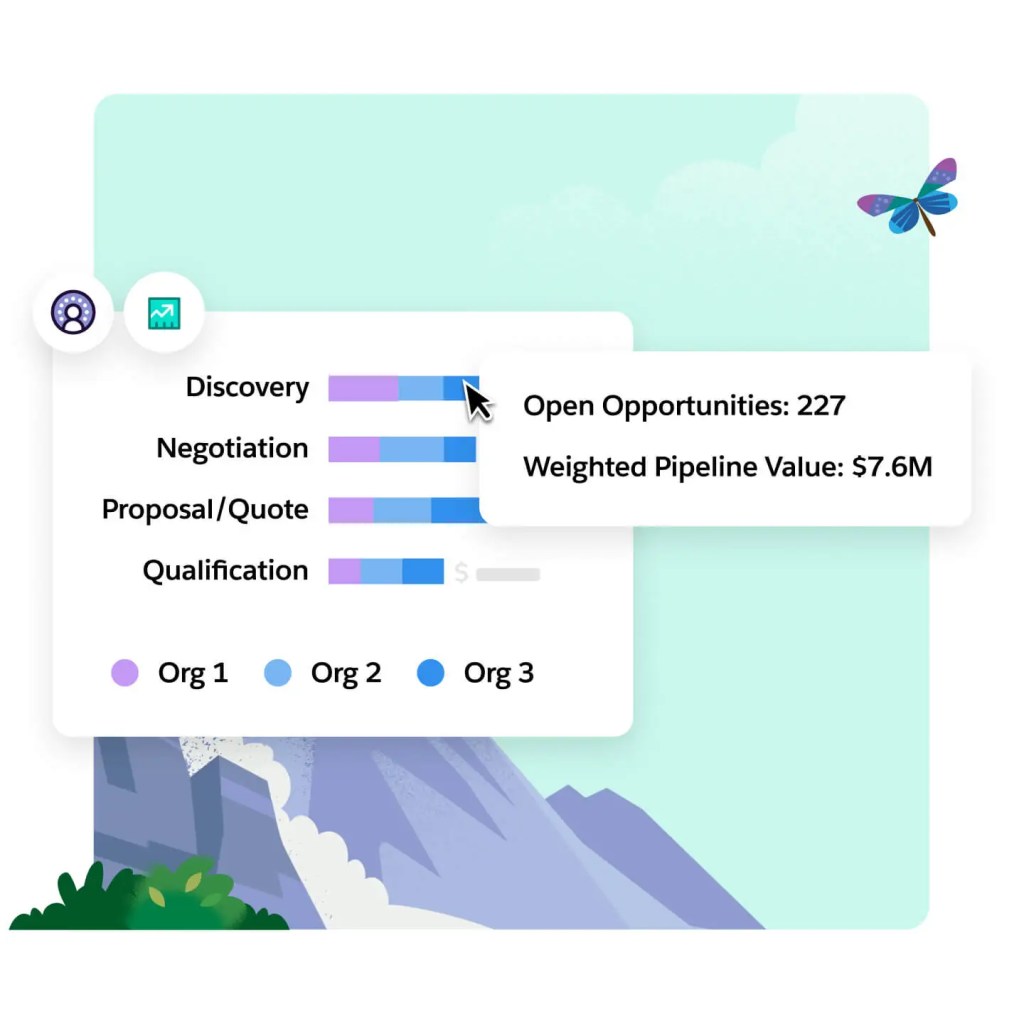
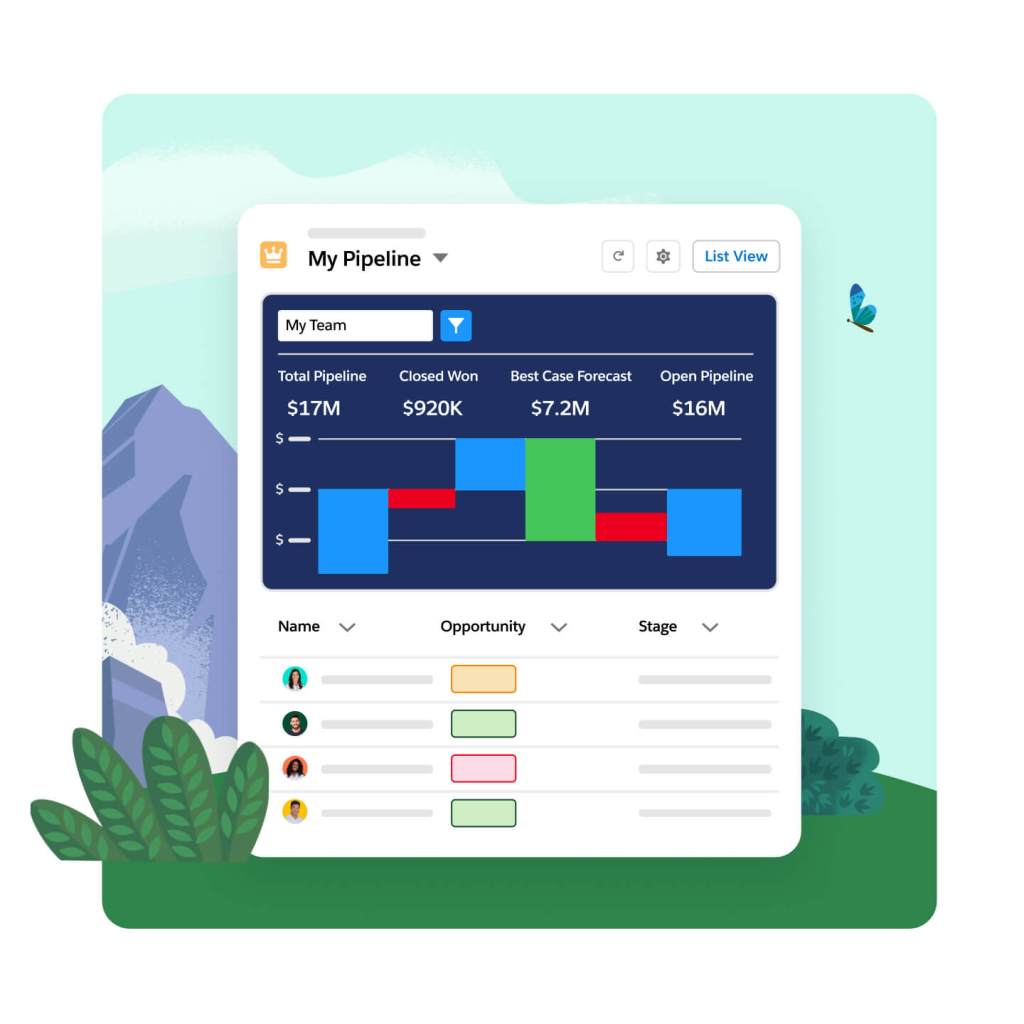
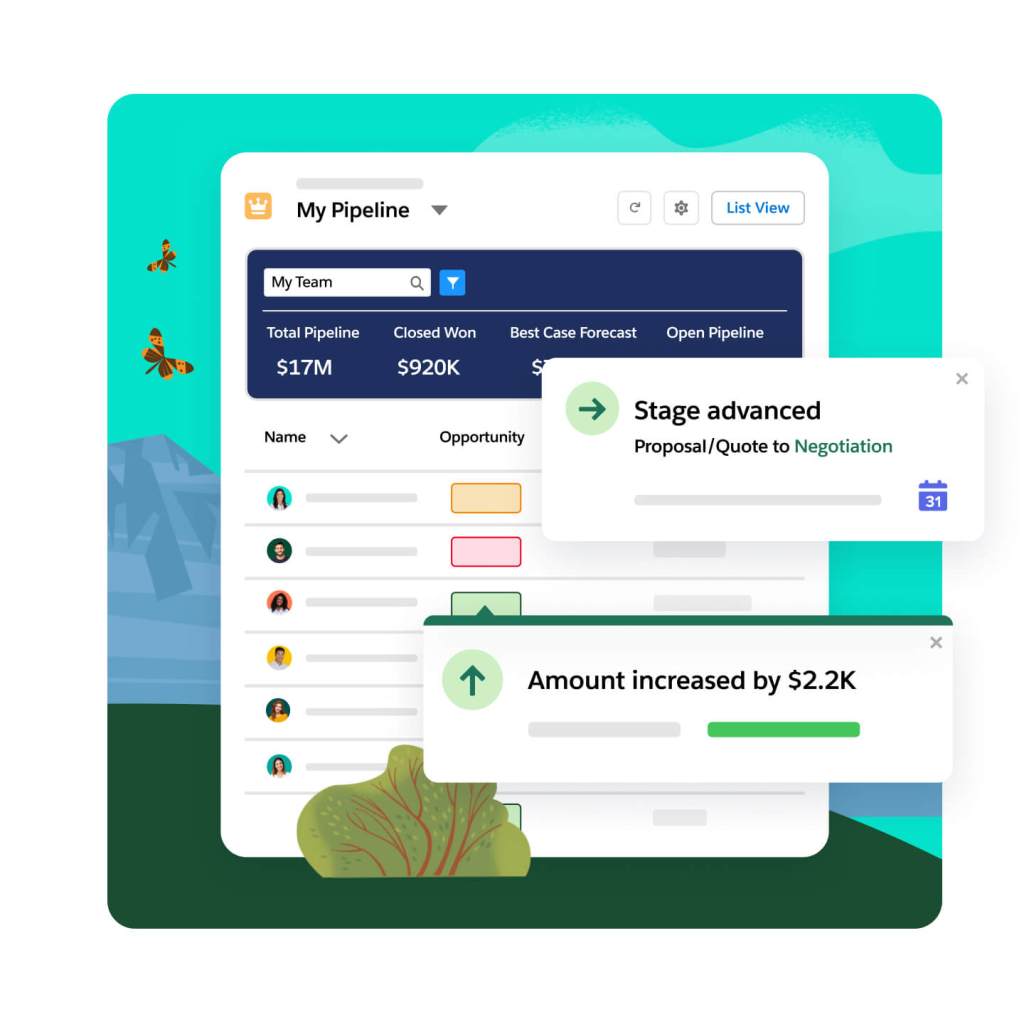
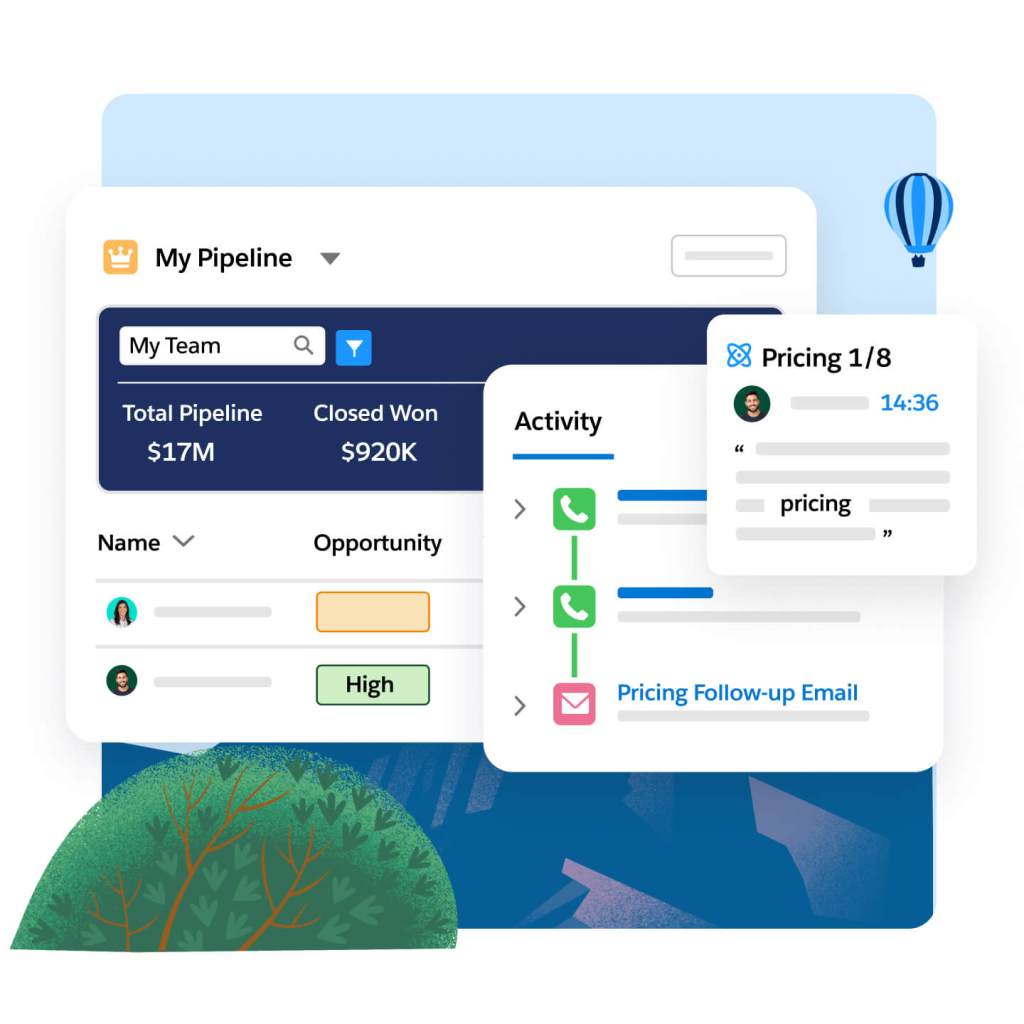
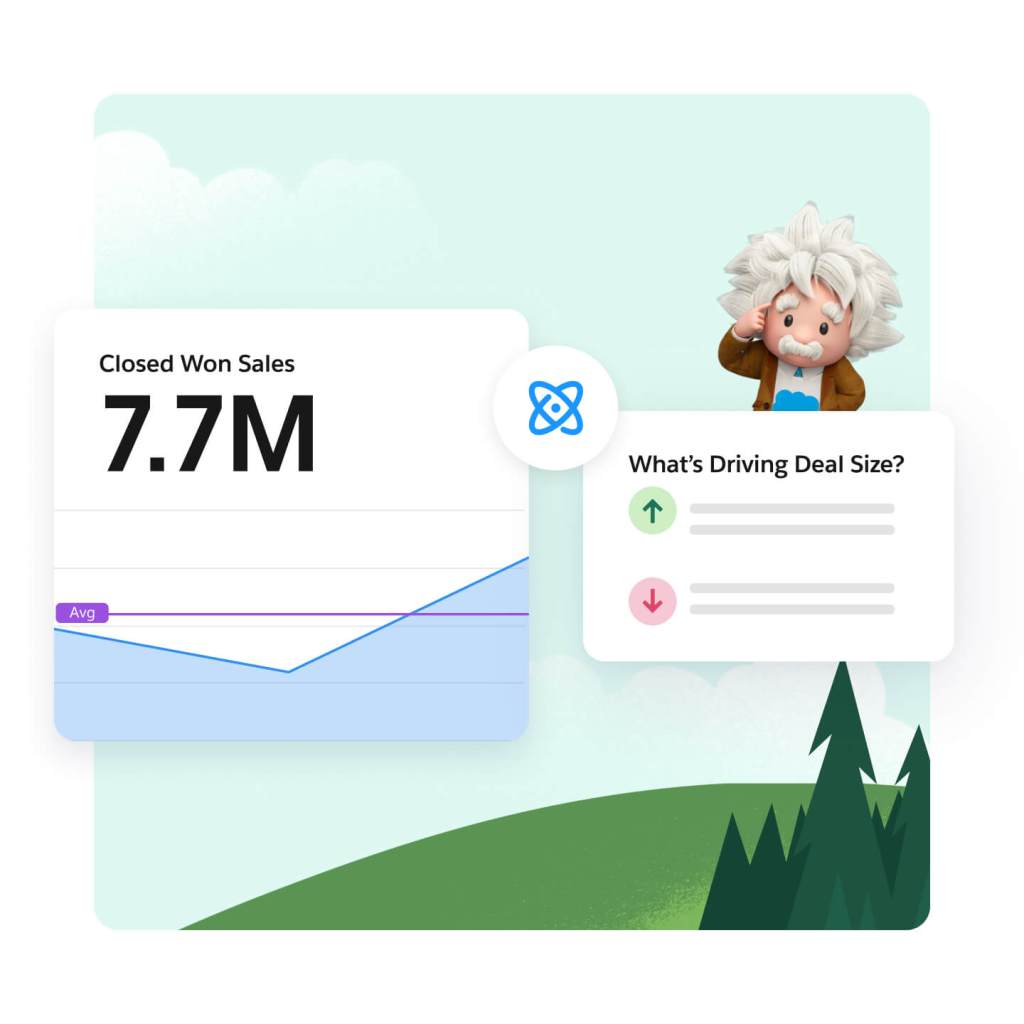
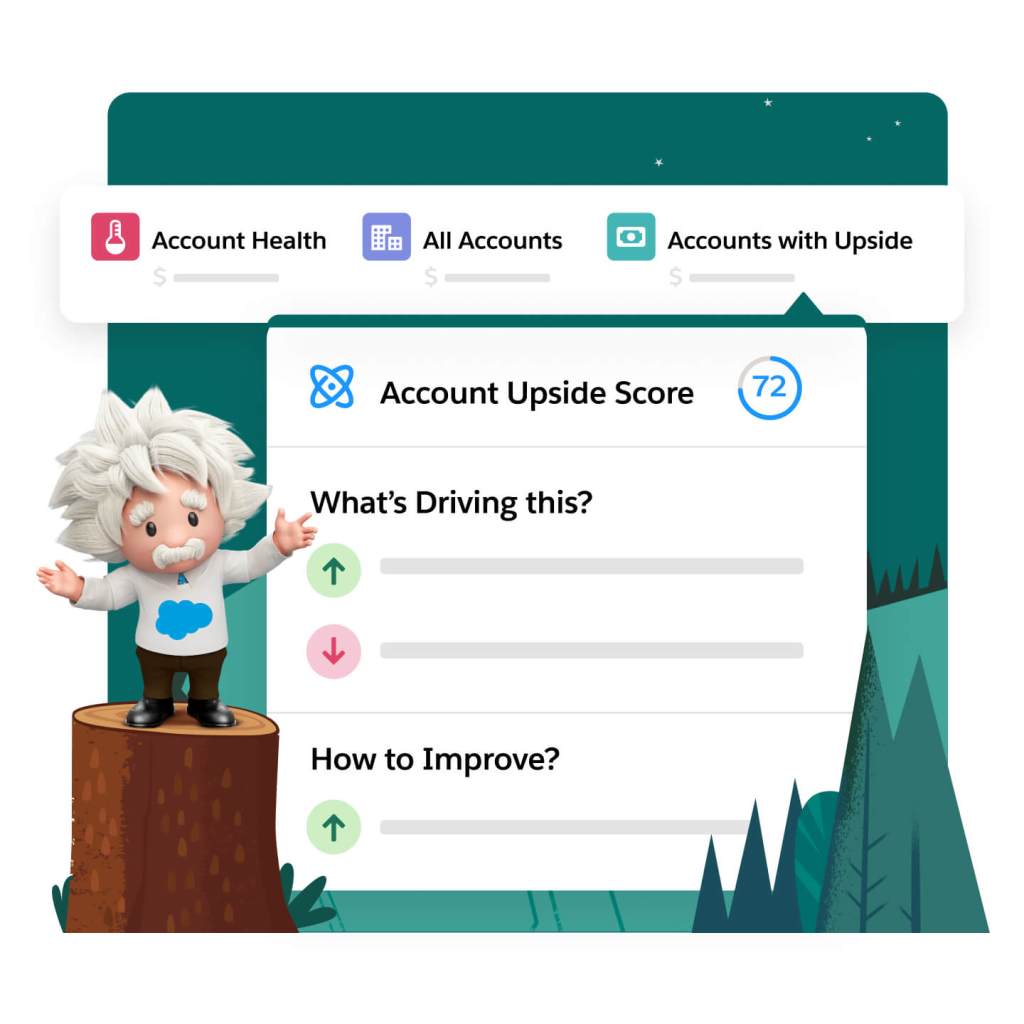
Sell smarter with sales analytics software built directly into your CRM. Get a complete view of sales performance, deal inspection capabilities, and rich visualisations. Drive forecast accuracy. Close faster. And speed up revenue intelligence with Sales Cloud and Tableau.

How can sales analytics software help teams forecast better and win more deals?

Predict, plan, and deliver your targets and outcomes with data-driven selling.

Predict business outcomes with confidence with sales analytics software.

Forecasting

Predict the likelihood of winning an opportunity, with each sales stage mapped to a forecast category such as Pipeline, Best Case, Commit, Closed, and Most Likely. Easily customise and define categories to match unique business processes and sales cycles. Increase forecast precision through live rollups by selecting either single forecasts, displaying values from individual categories, or cumulative forecasts that combine values from multiple categories.

A dashboard shows a list view of contacts that can be filtered, Einstein prediction details, and the sales increase amount.

Build custom forecasting pages for your unique sales process with standard and custom components — with clicks, not code. Increase forecast accuracy by allowing first-line managers to easily asses opportunities and make accurate and informed adjustments. Forecast with flexibility by team, product families, product schedules, territories, opportunity splits, and custom measures — all without a single spreadsheet.

A forecast is broken down into segment, teams, industry, and product line, with a button for pipeline inspection.

Visualise the health of your sales forecasts with built-in charts. Easily track changes in the current period and assess performance against past periods — without manual calculations. Gauge whether the team is tracking to hit sales goals based on past performance. Gain data-backed confidence with KPIs that showcase how your sales numbers compare with Einstein’s predictions. Quickly asses and take action on which forecasts have shifted with visual cues and alerts.

See forecast broken down by quarter, quota, best case forecast, and open pipeline. Examine deals in your pipeline closely.

Forecast across departments and geographies. Or however you segment your business. Bring all your opportunity data across every org and every system into a single view with Data Cloud.

Forecast across multiple orgs, products, and teams with a unified view of all your opportunities.
A dashboard shows a list view of contacts that can be filtered, Einstein prediction details, and the sales increase amount.
A forecast is broken down into segment, teams, industry, and product line, with a button for pipeline inspection.
See forecast broken down by quarter, quota, best case forecast, and open pipeline. Examine deals in your pipeline closely.
Forecast across multiple orgs, products, and teams with a unified view of all your opportunities.

Close faster with pipeline insights.

Pipeline Inspection

Empower sales teams to prioritise their efforts with a unified view of pipeline metrics, top opportunities, and weekly deal updates. Visualise changes in the pipeline and understand factors behind these shifts so you can strategize on how to bridge the gap. Keep opportunities current with easy inline field editing. Drive focus by flagging crucial deals and alerting sellers when next steps haven't been updated.

A dashboard filters pipeline by team and breaks down further by team member, opportunity, and stage.

Spot risks early with weekly change signals that include visual cues and alerts. Prioritise opportunities by their likelihood to close and understand which opportunities have moved tiers. Coach reps to focus on the right actions to move deals forward.

Filter shows deal info by team, total pipeline, closed won, best case forecast, open pipeline and deals that need attention.

Surface insights, predictions and recommendations from opportunities, calls, emails, and cases. Help reps move deals forward by choosing which insights to show. See deal progression, trends from voice and video insights, context from relevant emails, insights from service cases and more. Discover if the right stakeholders are involved for deals in the pipeline, and how engaged they are.

Dashboards show opportunity score and recent deal activity, as well as pipeline details.
A dashboard filters pipeline by team and breaks down further by team member, opportunity, and stage.
Filter shows deal info by team, total pipeline, closed won, best case forecast, open pipeline and deals that need attention.
Dashboards show opportunity score and recent deal activity, as well as pipeline details.

Grow revenue faster with purpose-built AI and sales analytics software.

Revenue Intelligence

Build stronger pipelines, improve forecast accuracy, and generate more revenue with out-of-the-box dashboards that give performance insights to your sales team. Gain a complete view of revenue performance with insights into the areas to focus on, like opportunities moving to the next stage. Learn if sales are trending up or down with details such as average win rates and sales size, and days to close. Use the Commit Calculator to test scenarios and understand how changes to pipeline can affect the bottom line.

A line graph shows a 7.7M close won rate with a notification that tells the user what's driving deal size.

See which accounts have potential for growth or need more attention with access to dashboards and machine learning models. Get a comprehensive view of account health via KPIs like health, engagement, win rate, average deal size and more.

A tab shows account health, all accounts, and accounts with upside. A menu gives account upside score and reasons why.
A line graph shows a 7.7M close won rate with a notification that tells the user what's driving deal size.
A tab shows account health, all accounts, and accounts with upside. A menu gives account upside score and reasons why.

Get the most out of your Sales Analytics software with partner apps & experts.

Accelerate revenue growth with thousands of pre-built and consultant offerings on AppExchange. Check them out today.

Atrium logo
Demandbase logo
PWC logo
Slalom logo
Salesblazers George and Carol pictured with Zig

Join the Salesblazer Community.

Looking to meet and learn from fellow sales professionals? Our Salesblazer Community is the place for you.

Become a Salesblazer with free, guided learning on Trailhead.

Frequently asked questions.

Sales analytics enables businesses to analyse their sales data and gain insights into their sales performance. These tools help businesses identify sales trends, track sales metrics, and optimise their sales strategies.

Sales analytics in CRM refers to the use of data analytics and business intelligence techniques to analyse sales data and gain insights into customer behaviour, sales performance, and revenue growth. It enables businesses to make data-driven decisions to optimise their sales strategies.