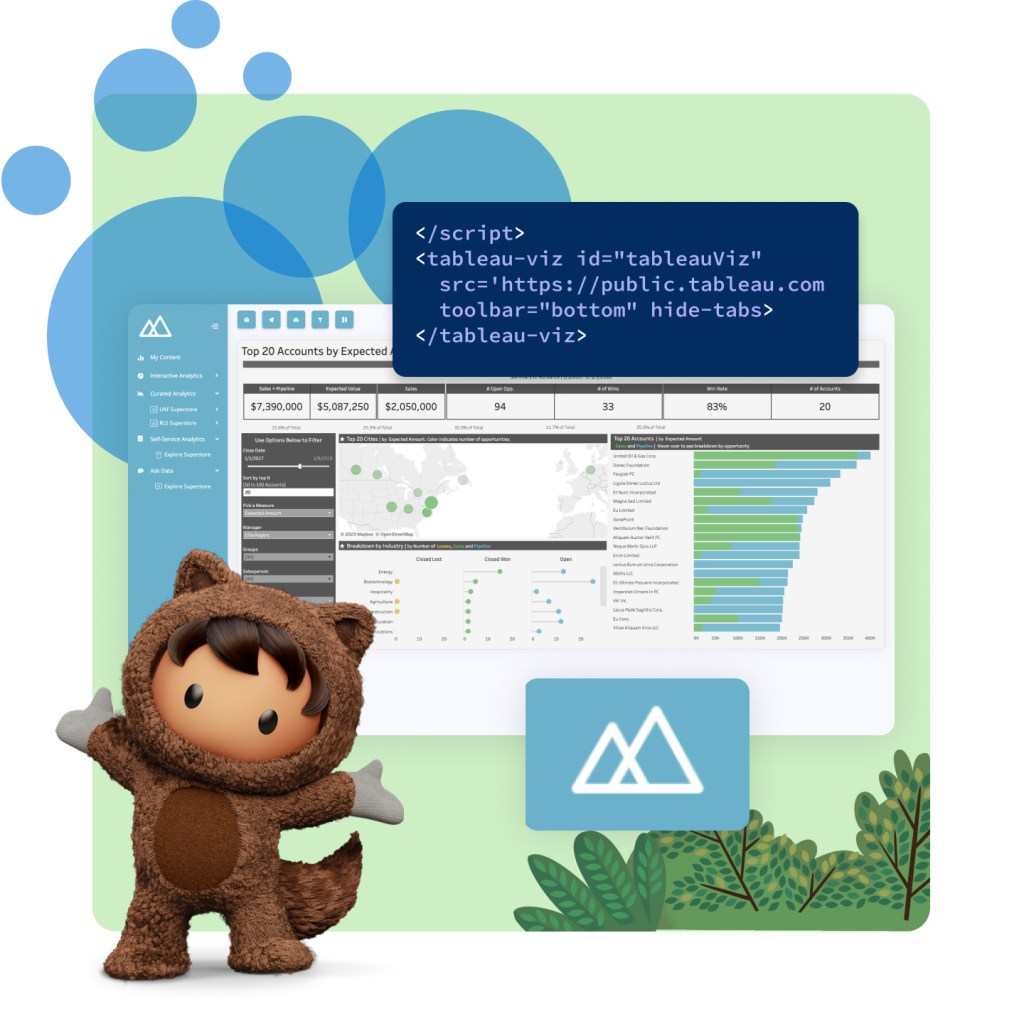
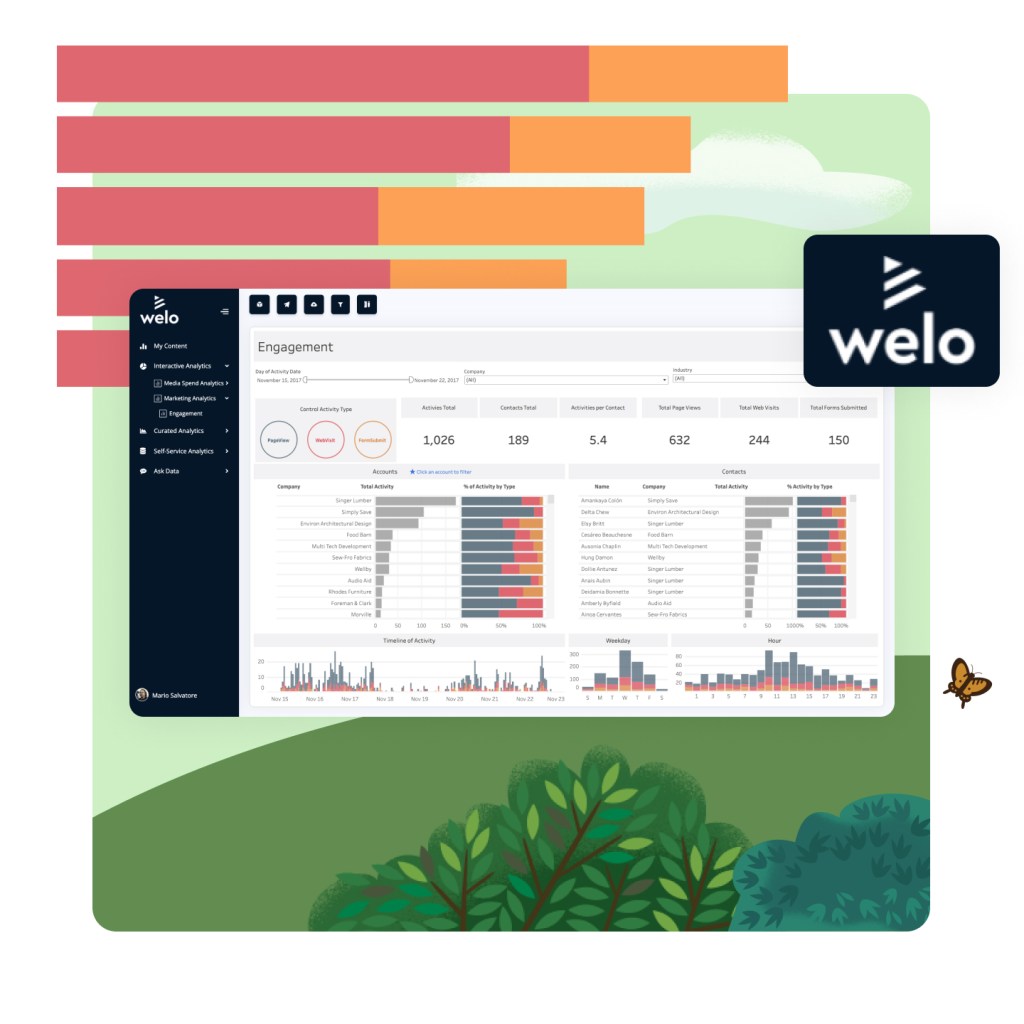
Three Tableau data visualizations, including Gestures (viz overlaid on video footage), paired with Data Rockstar Astro

Data Visualisation

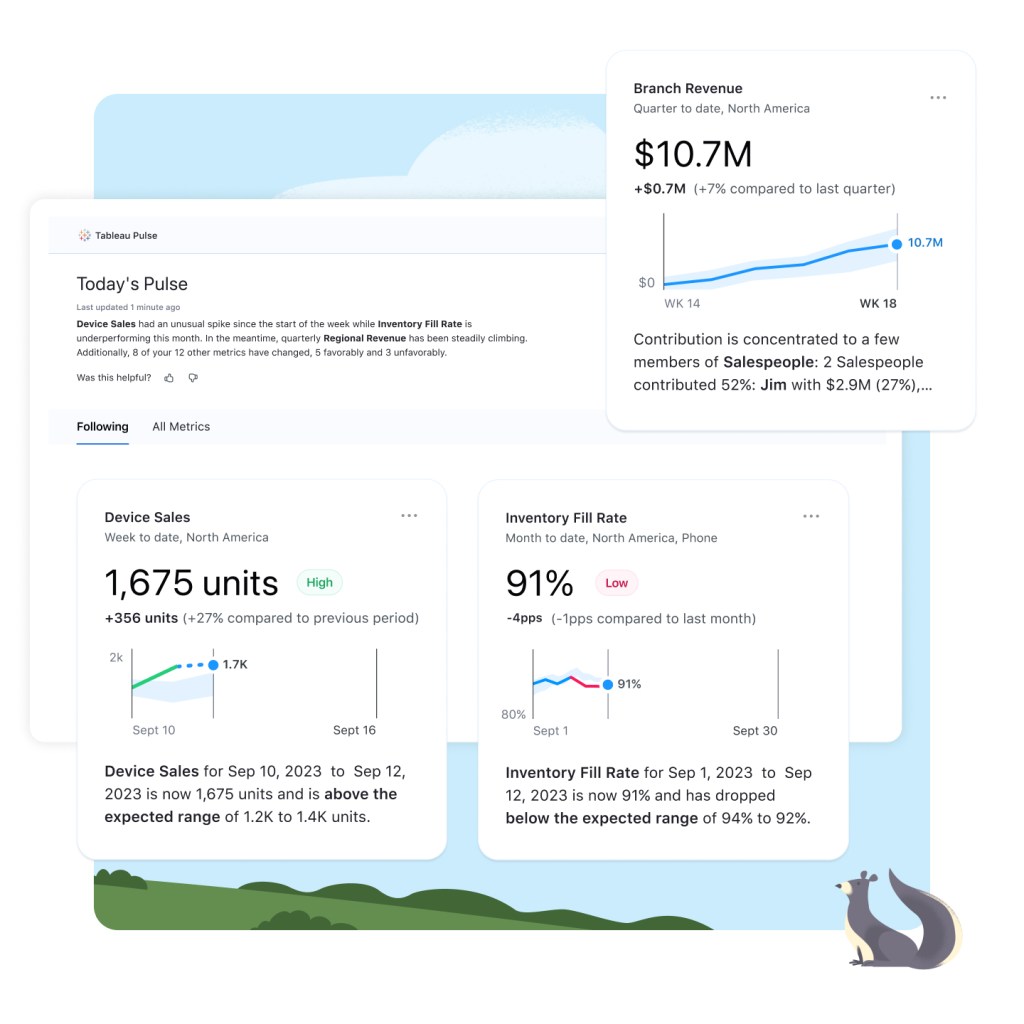
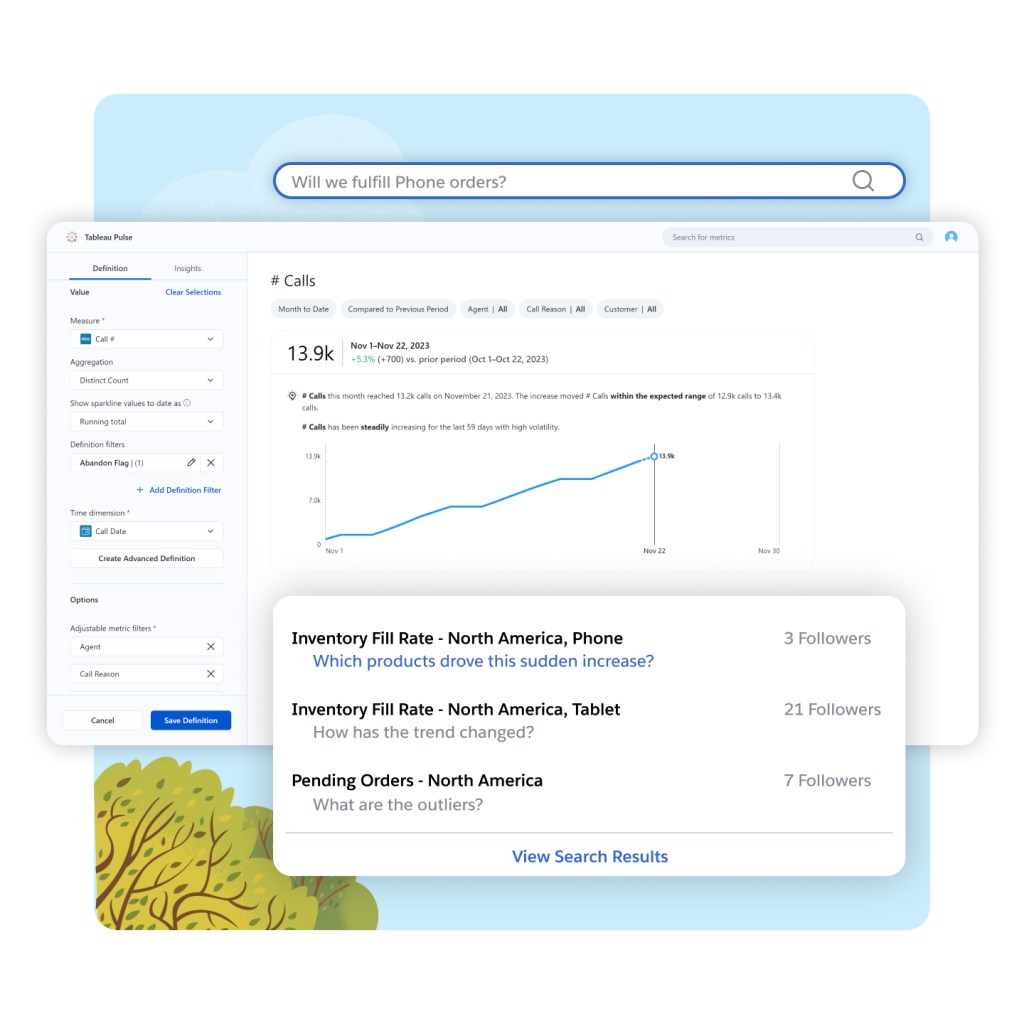
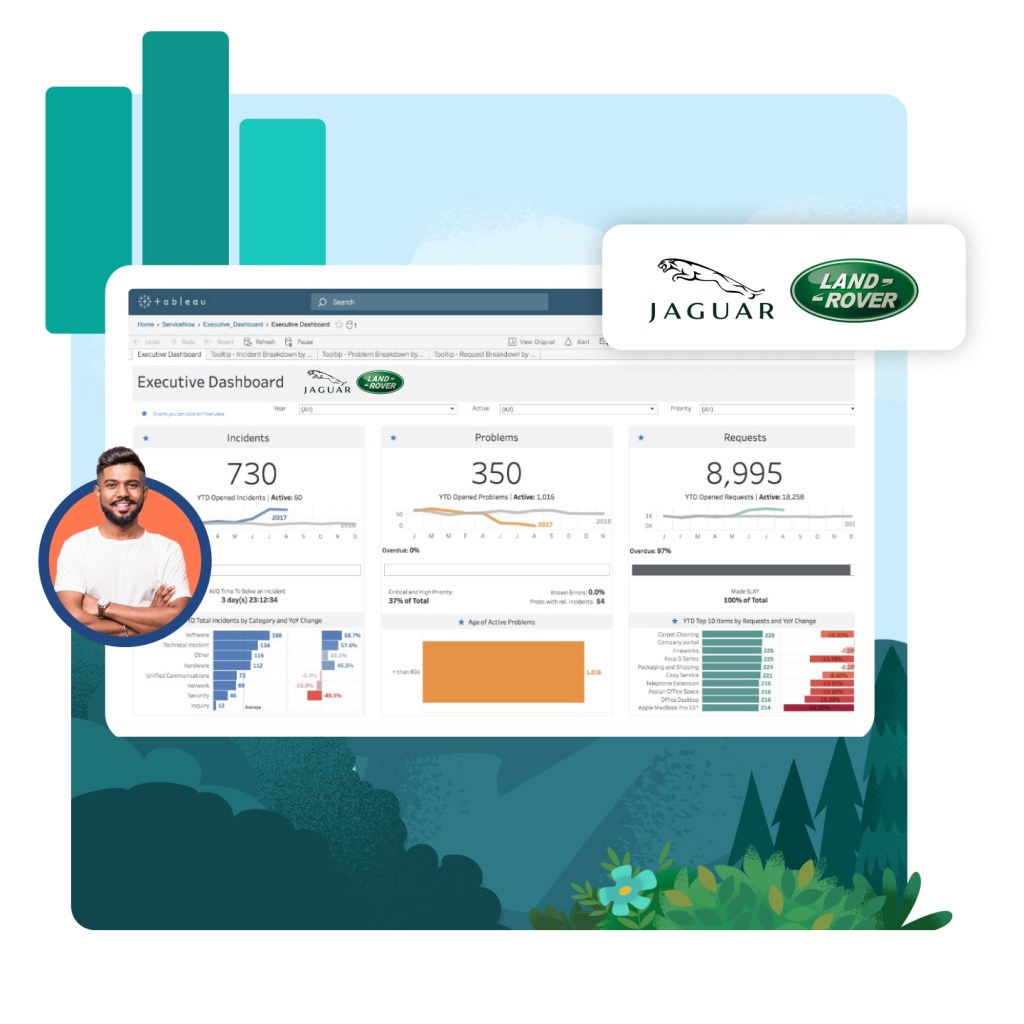
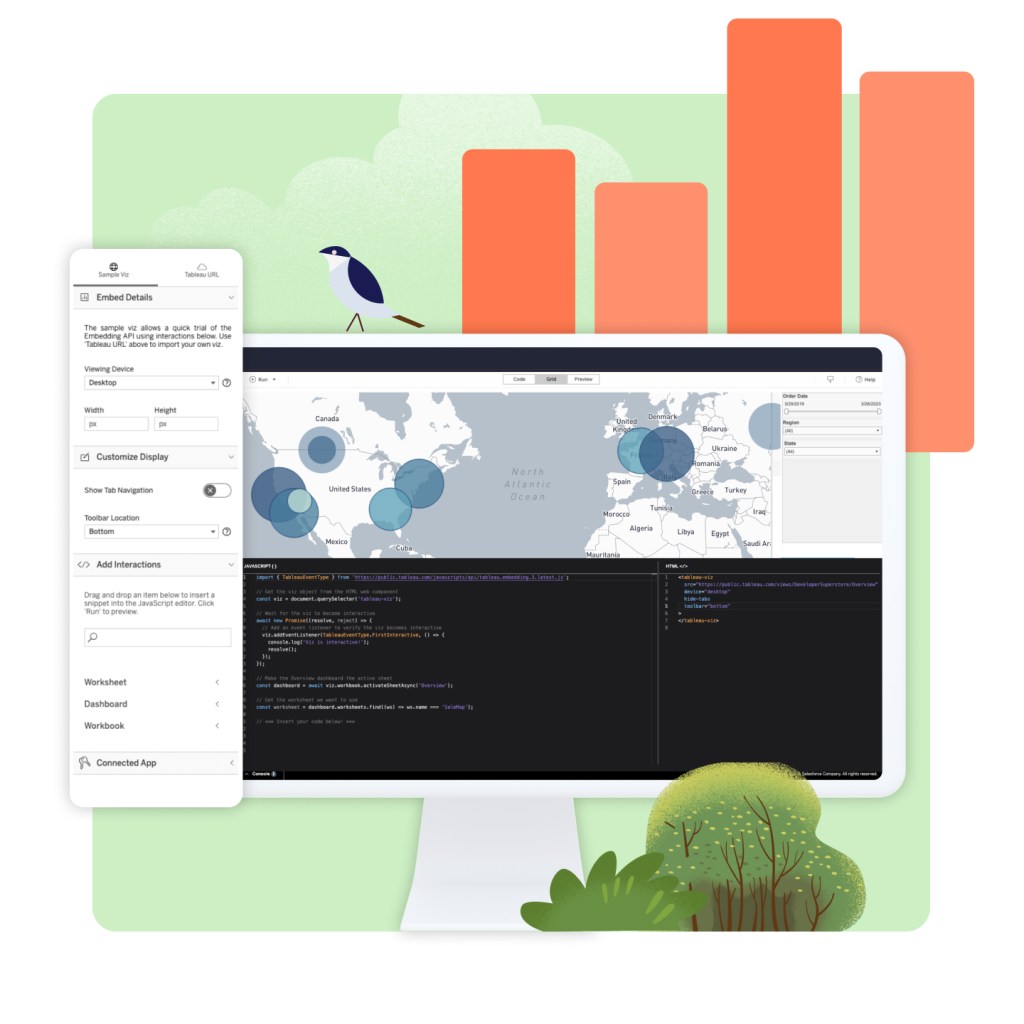
Intuitively organise and present information with data visualisation capabilities built directly into your CRM and Tableau. Tell visual stories to help everyone see, understand, and act on your data with a trusted data visualisation platform.

Here's how data visualisation tools can set your organisation apart.

32 %
increase in business user productivity
26 %
decrease in time to analyse information
33 %
increase in insights-driven decision making
Competitive landscape chart showing Tableau and other Augmented BI Platforms, as ranked by Forrester Wave

Forrester Wave™: Augmented Business Intelligence Platforms, Q2 2023

See how Salesforce and other providers stack up against each other ... and your needs.

See, interact with, and better understand your data.

Move beyond pretty dashboards with AI-enhanced data visualisations that drive action right in the flow of work. Tap into the art of combining insightful analysis with expert storytelling to optimise the impact of enterprise data and make better, smarter decisions.

Connect the dots between data and insights with best-in-class data visualisations.

Tableau Cloud

Unlike traditional methods where you’d painstakingly build charts and graphs from scratch, Tableau lowers the barrier to entry with an intuitive, drag and drop interface. Create, engage, and interact with data by building data visualisations in Tableau.

Waving Data Rockstar Astro and Tableau UI with files being dragged into the platform to create data visualizations

Informative, multi-dimensional, comprehensive and beautiful, data visualisation tools in Tableau empower everyone to organise and present information intuitively. Tap into an extensive data viz library, including geospatial insights and more, to tell visual stories around data trends, outliers, and patterns.

Tableau dashboard in monitor with Show Me panel displayed

Access lineage and provenance of data sources in the analysis process to help choose the correct data and know and trust its freshness and origin.

Tableau dashboard with US map viz and data source details highlighted
Waving Data Rockstar Astro and Tableau UI with files being dragged into the platform to create data visualizations
Tableau dashboard in monitor with Show Me panel displayed
Tableau dashboard with US map viz and data source details highlighted

Automate data visualisations for the metrics that matter most to you.

Tableau Pulse

See the metrics and insights that matter most to you and your work—curated into a personalised digest. Activate your team to focus on the same shared goals, without having to dig for information across several data sources, to make appropriate and timely decisions.

Tableau Pulse UI: Today's Pulse with highlights for metrics user is following, including branch revenue and device sales

Understand the “why” behind your insights with follow-up questions—simply type your own or follow guided question suggestions from Tableau AI. Get digestible answers from Tableau Pulse that pair plain, natural language insights with data visualisations.

Device Sales metrics with search bar question (will we fulfill phone orders?) and suggested metrics to answer question

Use natural language to quickly set up dashboard actions and speed up repetitive tasks, such as applying your organisation's custom formatting.

Tableau Executive Dashboard example for Jaguar Land Rover, with photo of JLR exec
Tableau Pulse UI: Today's Pulse with highlights for metrics user is following, including branch revenue and device sales
Device Sales metrics with search bar question (will we fulfill phone orders?) and suggested metrics to answer question
Tableau Executive Dashboard example for Jaguar Land Rover, with photo of JLR exec

Embed visualisations wherever you need to create custom data experiences.

Tableau Embedded Analytics

Access an interactive learning environment where you can rapidly develop embedded analytics solutions. Get hands-on experience embedding, customising, and integrating Tableau with your application.

Tableau Embedding Playground world map with developer pane open

Quickly build visualisations and dashboards with an easy authoring experience, then embed them within your applications with a few lines of code using the Embedding API. You'll be able to maintain the seamless look and feel of your brand, while leveraging the frameworks and programming languages your developers already know.

Astro character with open arms in front of white labelled account dashboard and code lines

Edit, update, and create new content without ever leaving your preferred application. Jumpstart development and customisation by adding unique features to dashboards using Tableau Extensions.

Tableau dashboard for engagement data, whitelisted for welo brand
Tableau Embedding Playground world map with developer pane open
Astro character with open arms in front of white labelled account dashboard and code lines
Tableau dashboard for engagement data, whitelisted for welo brand

Get the most out of data visualisation with thousands of partner apps and experts.


Atrium
Slalom
Biztory
Accenture
Interworks
The Information Lab
Tableau Community members in DataFam sweatshirts and Data Rockstar Astro

Join the Tableau Community.

Join a community that supports your Tableau journey, brings your data skills to the next level, and nurtures powerful connections. When people are united by data, anything is possible.

Learn new skills with free, guided learning on Trailhead.