

The digital surge we witnessed in the second quarter (Q2) should not come as a surprise to many. As nonessential brick-and-mortar stores closed, the consumer needed to go somewhere to make their purchases when the pandemic took hold. This past summer was punctuated by some of the largest increases we have ever seen in digital sales.
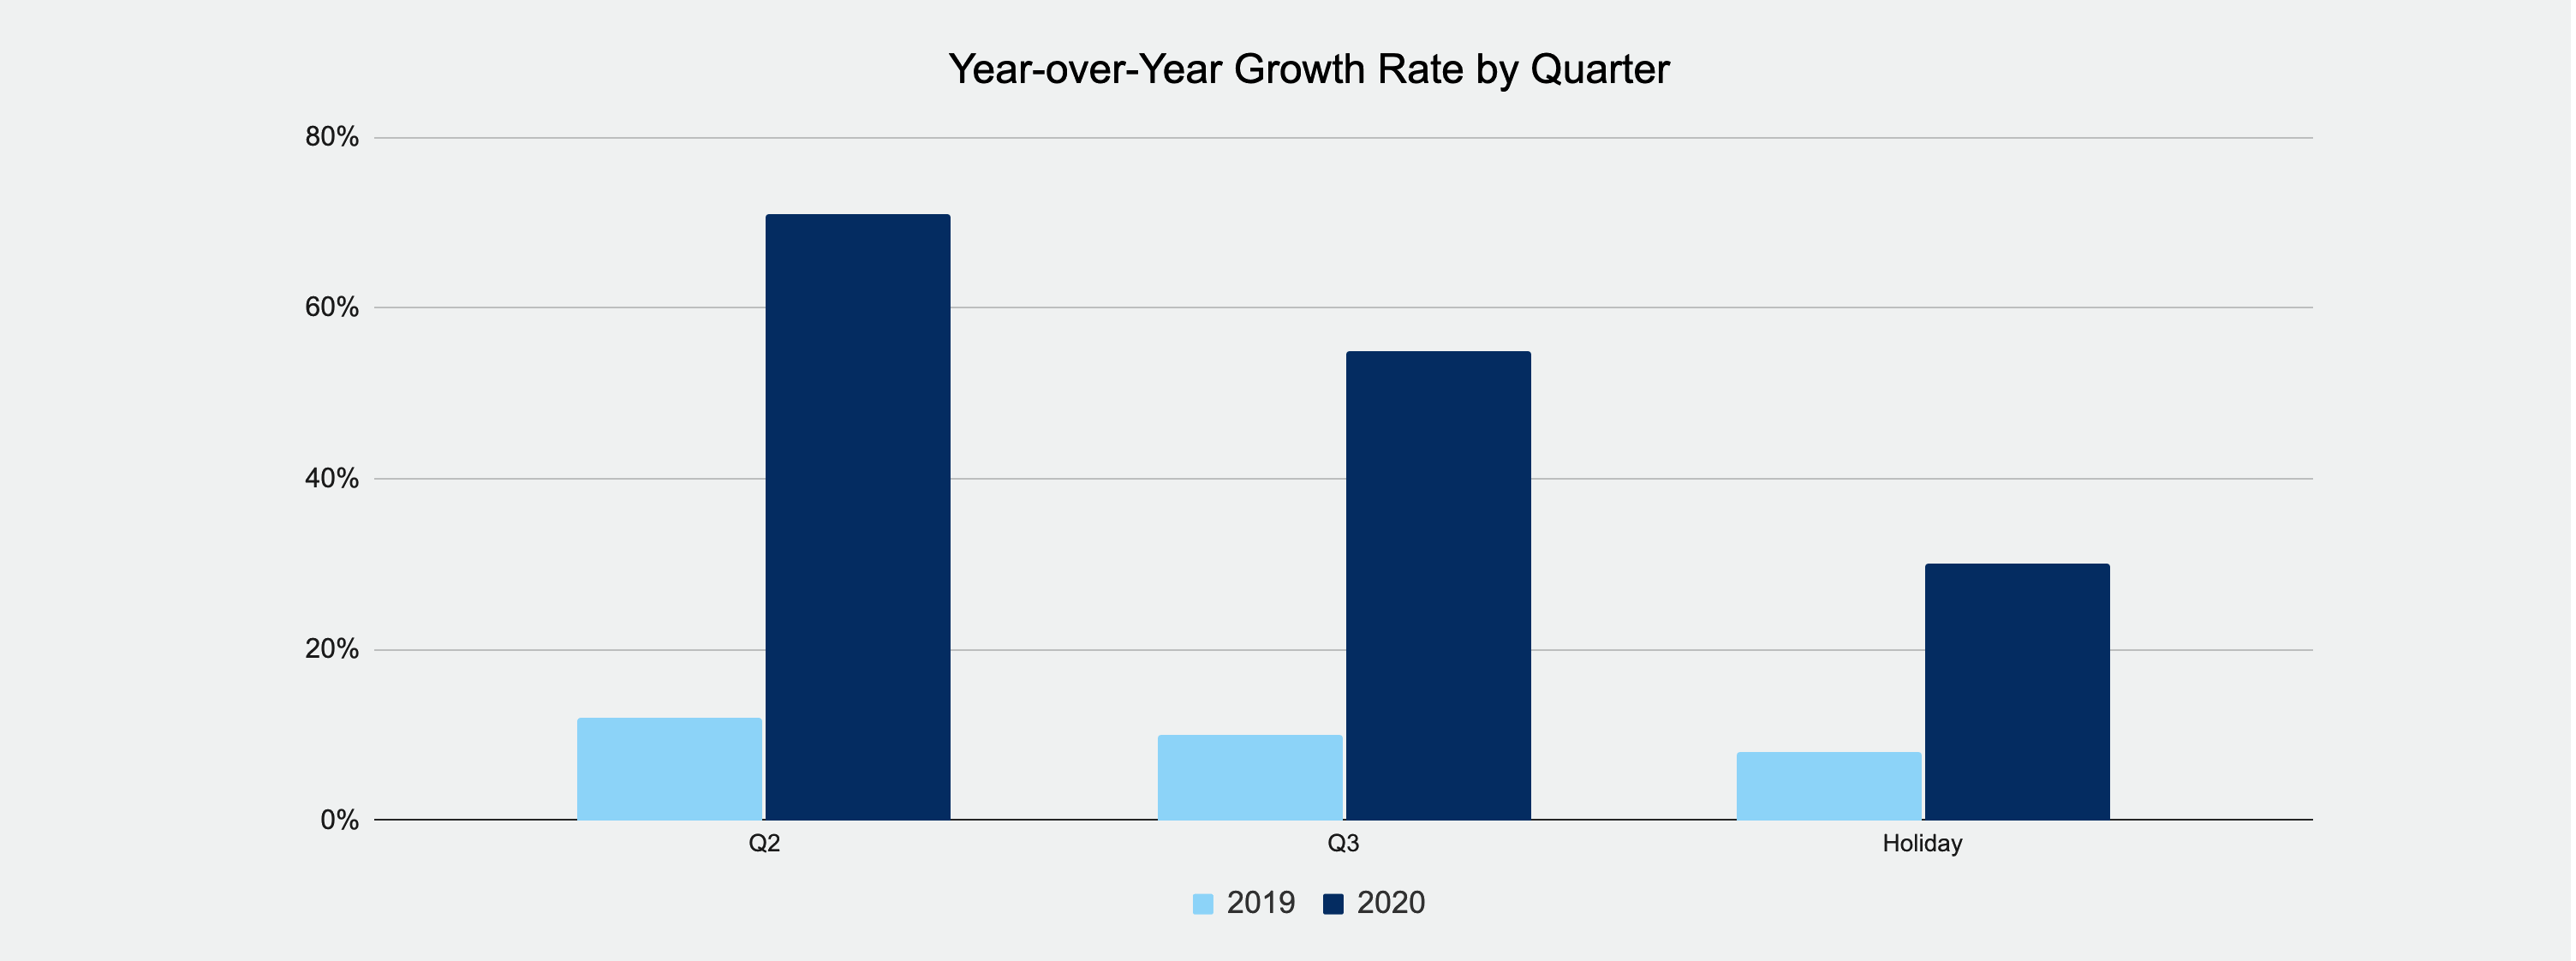
As we conclude the third quarter (Q3) and enter into fall, we see shoppers retain many of the digital behaviors adopted in Q2. Comparable global digital sales grew +55% year over year in Q3, a slightly downward trend from the +71% we observed in Q2 but still an impressive figure and certainly the highest we’ve seen in Q3 since we started the Shopping Index seven years ago.
But while shoppers displayed the same amount of interest as before, Q3 purchasers were more thoughtful, deliberate, and planned. Here are three main takeaways we can learn from the Q3 Shopping Index.
1. Shopper interest is there, but with more discerning tastes
Interestingly, digital traffic actually increased in Q3 more than it did in Q2. The 39% growth in digital traffic we observed for Q3 was higher than the 37% we first saw when the pandemic took hold this summer. In other words, the interest is there. Shoppers are still “digital browsing” at the same pace but deliberate a lot more prior to purchase.
The all important conversion rate increased an eye popping +35% year-over-year (YoY) in Q2. In Q3 that increase has steadied down a bit to +20% and is likely driven by the fact bulk purchasing has quieted down in Q3, as supply chains caught up with demand and most nonessential retail stores reopened by the end of June.
One thing is clear — despite a Q3 slow down in digital spend, consumers are turning to digital channels at record rates. Whether to browse, research, or buy, the convenience of digital reaches all generations of consumers.
2. Consumer spending shifts to convenience over indulgence
In Q3, the growth in the “Toys and Games” category dipped down to 76% from its position as the top performing category with the 181% growth we observed in Q2, And this makes sense, right? Toys and games can be reused and a single purchase can last.
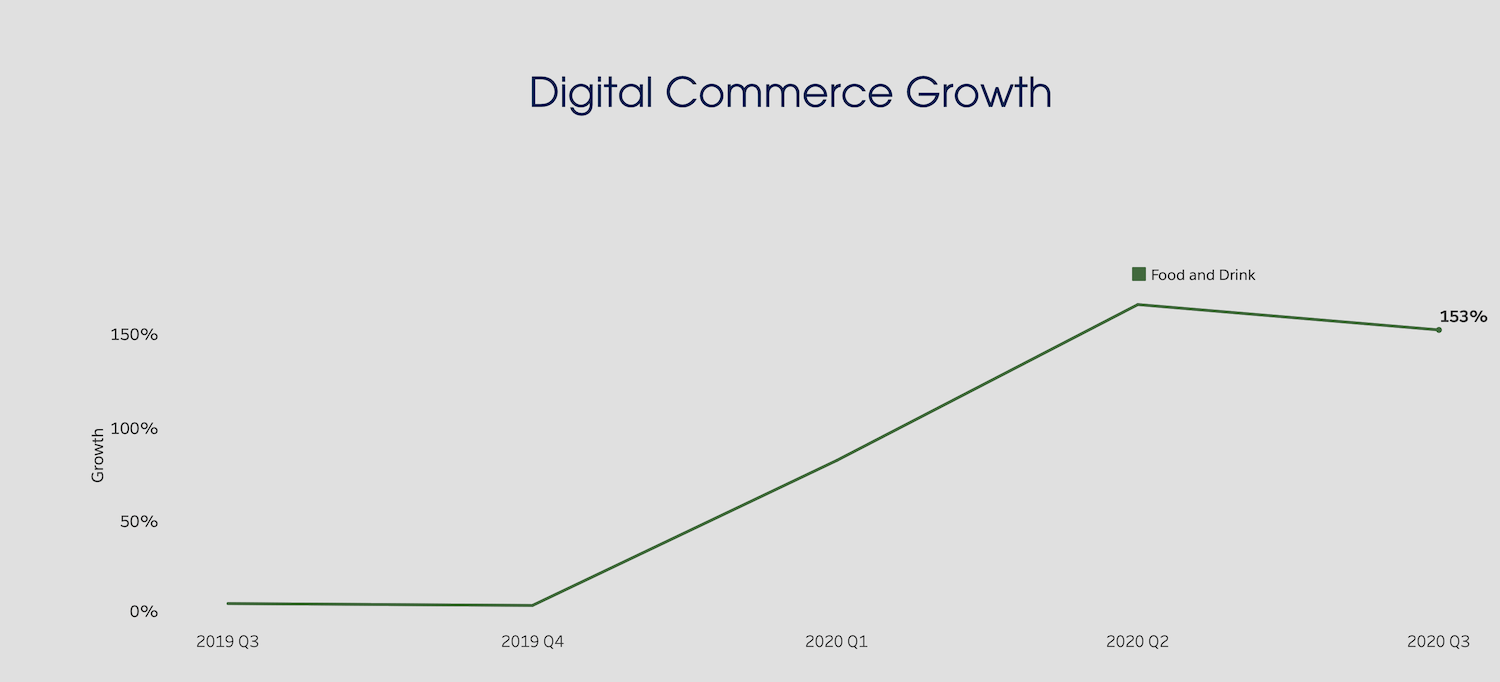
But what about the top performing category in Q3, coming in at 153% growth? For the big Shopping Index fans, you’ll notice that in this quarter’s edition we’ve added a new category into the mix: “Food and Drink.” The growth rate across both Q2 and Q3 remained elevated at 150%+, representing the strongest-growing category over the last two quarters.
“Food and Drink” has historically had the lowest online penetration of all verticals, but two quarters of strong digital sales growth (even at a low base) suggest online grocery habits are sticking even though stores have stayed open.
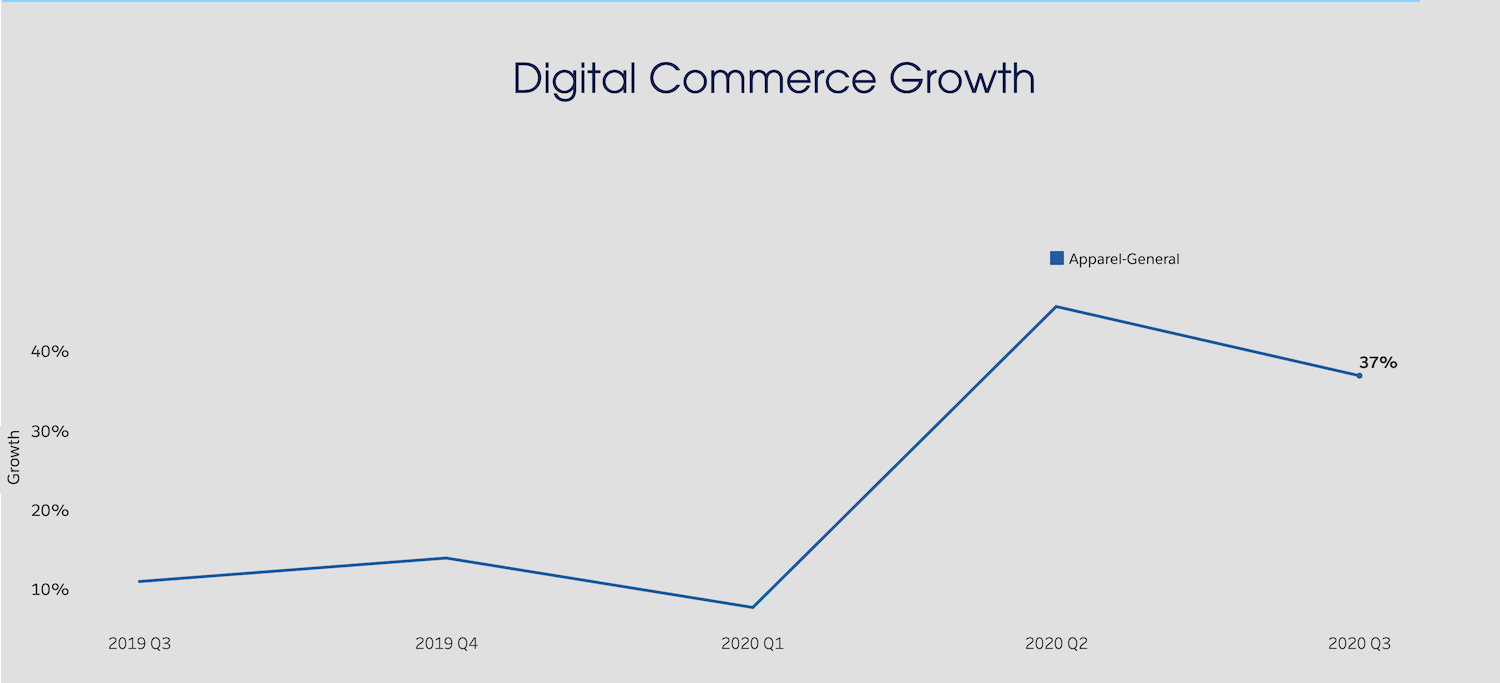
Meanwhile, “General Apparel,” “Luxury Apparel,” and “General Footwear” round out the bottom three categories. And, there seems to be very little improvement in merchandise you wouldn’t associate with shelter in place.
3. Setting the stage for a crucial holiday season
After three quarters, it all comes down to the all important holiday season. And for 2020, our prediction is the season will be off to an early start on October 13 with Amazon’s Prime Day, and several other retailers launching similar promotional campaigns at the same time — the holiday rush will begin early.
A key question remains, does the data we see point to anything towards the all-important growth rate we can expect for the holiday season? After all, many retailers and consumer brands make or break their financial year in the last quarter, and this year in particular, the stakes are high and bankruptcy is not uncommon.
In the latest Salesforce holiday predictions holiday growth rate for digital sales will be 30% globally, and 34% in the United States.
This trend is a continuation we noticed in the initial surge during Q2, moderation has taken place in Q3, and in our opinion, a further deceleration into the holiday period will continue as consumers reach a conservative equilibrium with their online purchases. This will happen due to uncertainty around the economy, health, and politics normalizing consumer demand.
It is also important to note we still predict an impressive growth in digital this holiday season, but also predict a decrease in brick-and-mortar sales, with some large retailers planning to close their doors for Thanksgiving and many others in active bankruptcy proceedings. We believe digital will be the primary merchandising and marketing channel and that all online holiday sales purchases will reach 30%.
Increase in online audience = more data and insights to share!
With online audiences increasing dramatically over the last two quarters and with more comprehensive visibility of our platform data, Salesforce is able to dig deeper and wider into our Shopping Index data set to introduce a few new categories and geographic regions.
1. Getting specific: We have introduced additional category splits for existing categories to provide a more refined level of benchmarking and visibility.
- Active versus General in Footwear
- Makeup versus Skin Care in Beauty
2. Additional categories: As we hinted earlier, we have also added brand new categories into the Shopping Index thanks to the digital surge and an expanded data set. Both of these entrants have been strong performers during the pandemic and we’re keen to see how they perform in upcoming quarters.
- Electronics
- Food and Drink

3. Additional regions: Digital commerce is indeed a global industry and the surge that we observed this year was a truly global phenomenon, where customers all over the world turned to the online channel for their purchases. This has opened the door for us to provide more comprehensive global coverage by adding one new region — APAC exclusing ANZJ:
- China
- Hong Kong
- Taiwan
- Malaysia
- South Korea
- Thailand
Takeaway
This year’s third quarter proved many of the digital habits consumers picked up in the first half of the year are beginning to stick. And while Q3 broke digital records, everyone’s eyes now look towards the holiday shopping season. Follow along with us in real time as we break down what undoubtedly will be a record breaking holiday season.
Q3 Shopping Index methodology
The Q3 Shopping Index uncovers the true shopping story through analyzing the activity of more than one billion shoppers across more than 41 countries powered by Commerce Cloud, with a focus on key 10 markets: U.S., Canada, U.K., Germany, France, Spain, Japan, Netherlands, Australia/New Zealand, and the Nordics. This battery of benchmarks provides a deep look into the last nine quarters and the current state of digital commerce. Several factors are applied to extrapolate actuals for the broader retail industry and these results are not indicative of Salesforce performance.
See the Shopping Index for yourself: