European Q2 Shopping Index Results


Europe shows signs of recovery, as Q2 2023 online sales continue the positive trend seen in Q1. Learn more here.

Rosemary Okolie
Global online sales in Q2 2023 were flat year over year (YoY) despite a 3% increase in digital traffic, according to the Salesforce Shopping Index, which analyses the shopping activity of almost two billion global consumers. Much like the previous quarter, the decline was predominantly driven by a slowdown in the U.S. where — for the first time in the history of the Shopping Index — there was a decline in online sales.
On the other side of the pond, however, things appear to be looking up — if the last couple of quarters are anything to go by. Here are some key European insights from Q2 2023.
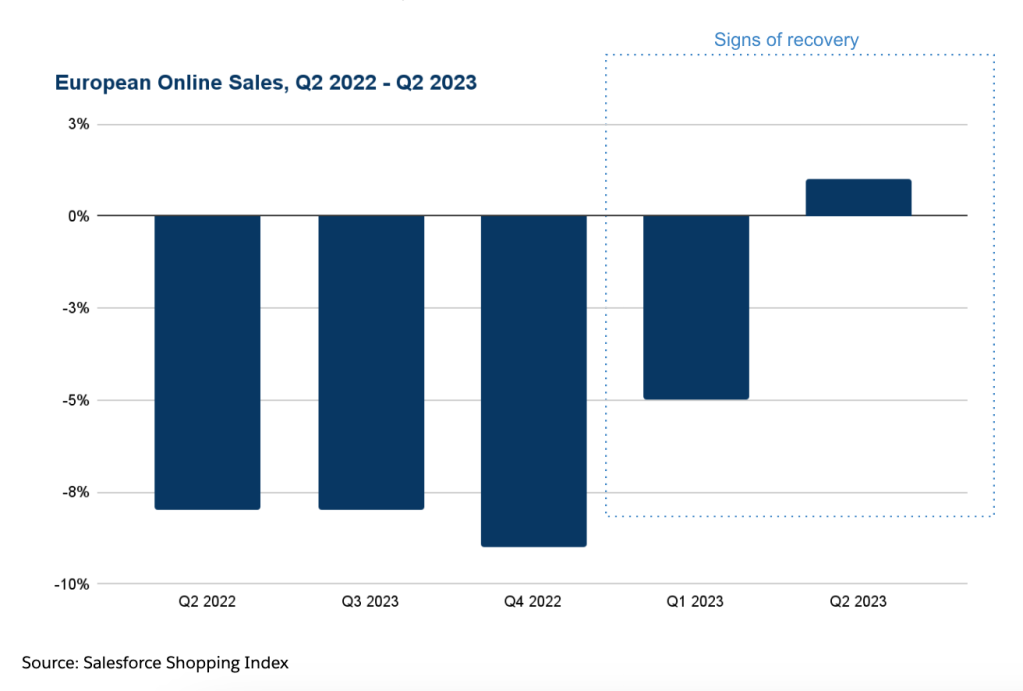
Europe is heading towards recovery
Admittedly one swallow doesn’t quite make a summer, but if the trend seen in the last two quarters is any indication, Europe is on the verge of recovery. In Q2 2023, digital commerce in the region grew 1% YoY, following some quarters of slowing declines. That said, order volume declined 6% and the overall average selling price (or ASP, meaning the average price of a unit sold) was up by 7% YoY, suggesting that some of this growth was driven by the persistent and widespread inflation seen across many parts of Europe.
In terms of the categories that saw the most growth in the quarter: luxury handbags (+34%), active footwear (+31%), health & beauty (+21%) and general footwear (+18%), were the top performers across Europe.
Most European countries returned to positive territory
Compared to many countries worldwide, some European countries saw the biggest growth in Q2. Of course, these comparisons favour European retailers to some degree, considering the particularly challenging conditions faced during the same period last year. Nonetheless, Spain and Belgium led the pack in Europe, with online sales up 11% in both countries.
In Spain, order volume grew 7% and Units Per Transaction (or UPT) remained fairly flat YoY, indicating that shoppers in Spain are certainly buying more, but with the average discount rate down 9% and ASP having grown 10% YoY, they’re also having to pay a lot more than they did for the same items a year ago.
In Belgium, order volume declined 12%, UPT declined slightly (-3%) and ASP increased by a notable 17% — shoppers here, it seems, spent more but didn’t buy more. Also worth mentioning is that while the use of credit cards in the region has been on a gradual decline for the last few quarters, the data shows a 31% YoY increase in the proportion of transactions that were paid for using Finance (which includes options like Buy Now, Pay later) in Q2.
At this point, it’s no longer surprising that Eastern Europe continues to record positive growth.
Digital sales in the region grew 10%, with order volume remaining flat during the period. That said, for the first time in at least four quarters, there was a decline in the average discount rate in the region (-7% YoY). The about-face in promotional tactics used over the last several quarters was likely prompted by the downward trend in inflationary pressure across the region and helped support growth in overall digital sales.
Italy was also positive in the quarter, with online sales up 8%. Order volume grew by 1%, despite a 3% drop in the average discount rate in the country. Much like Belgium, ASP also grew notably in Italy (+14%), helping to drive some of the growth seen in the quarter.
Other countries with positive growth in the region include France and Germany, both recorded digital commerce growth of 3% YoY.
Takeaway
Data for the first half of this year shows that despite inflationary pressures, consumers are starting to loosen their purse strings across some markets in Europe. For retailers, now’s the time to focus on delivering those seamless and personalised experiences that consumers have come to expect, to help drive engagement and loyalty.
European Q1 Shopping Index Results
Discover the key learnings about European shopping from Q1 2023.


Methodology
Powered by Salesforce platform data, the Shopping Index uncovers the true shopping story. We look at the previous nine quarters to uncover a deep understanding of how consumer behaviour is evolving and how the market is moving. The Shopping Index analyses the activity and online shopping statistics of more than 1.5 billion unique global shoppers from more than 67 countries. This battery of benchmarks covers both the recent history and current state of digital commerce. Several factors are applied to extrapolate macroeconomic figures for the broader retail industry, and these results are not indicative of Salesforce’s performance.