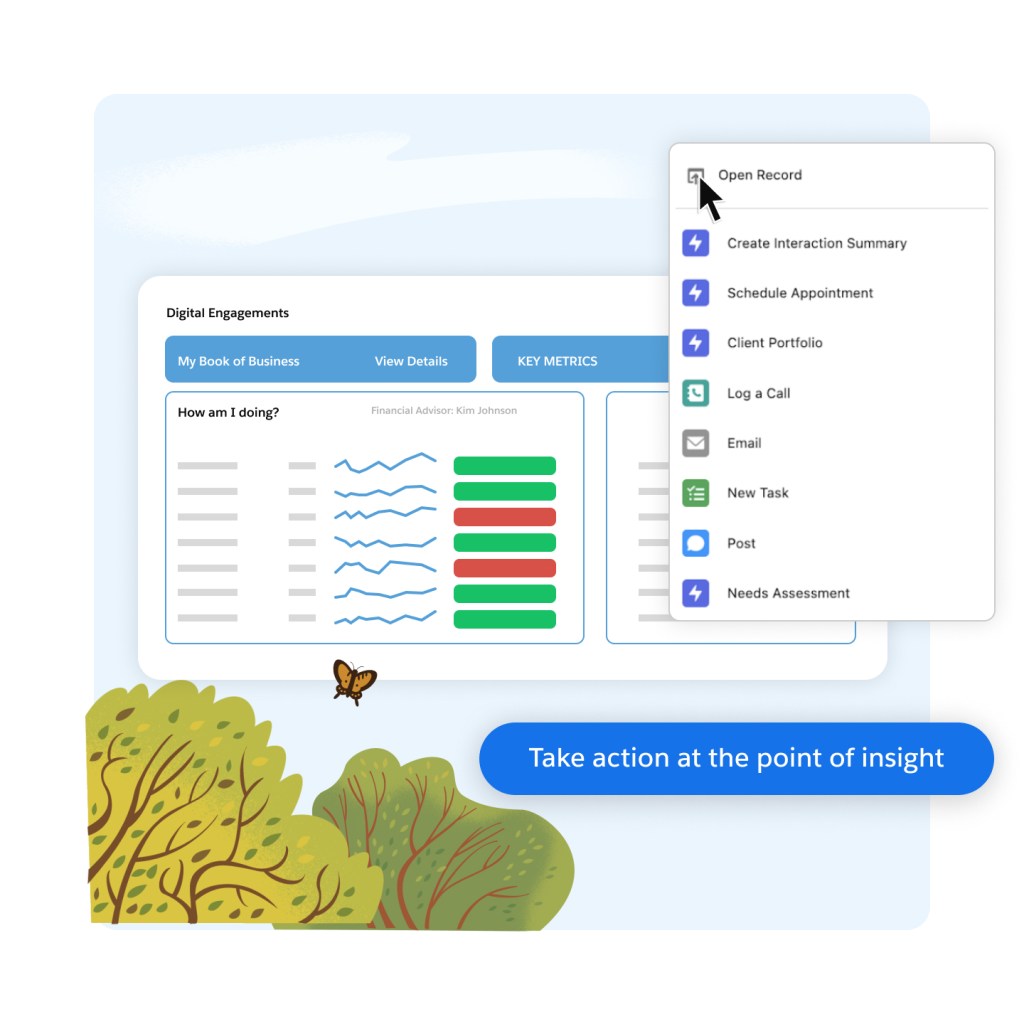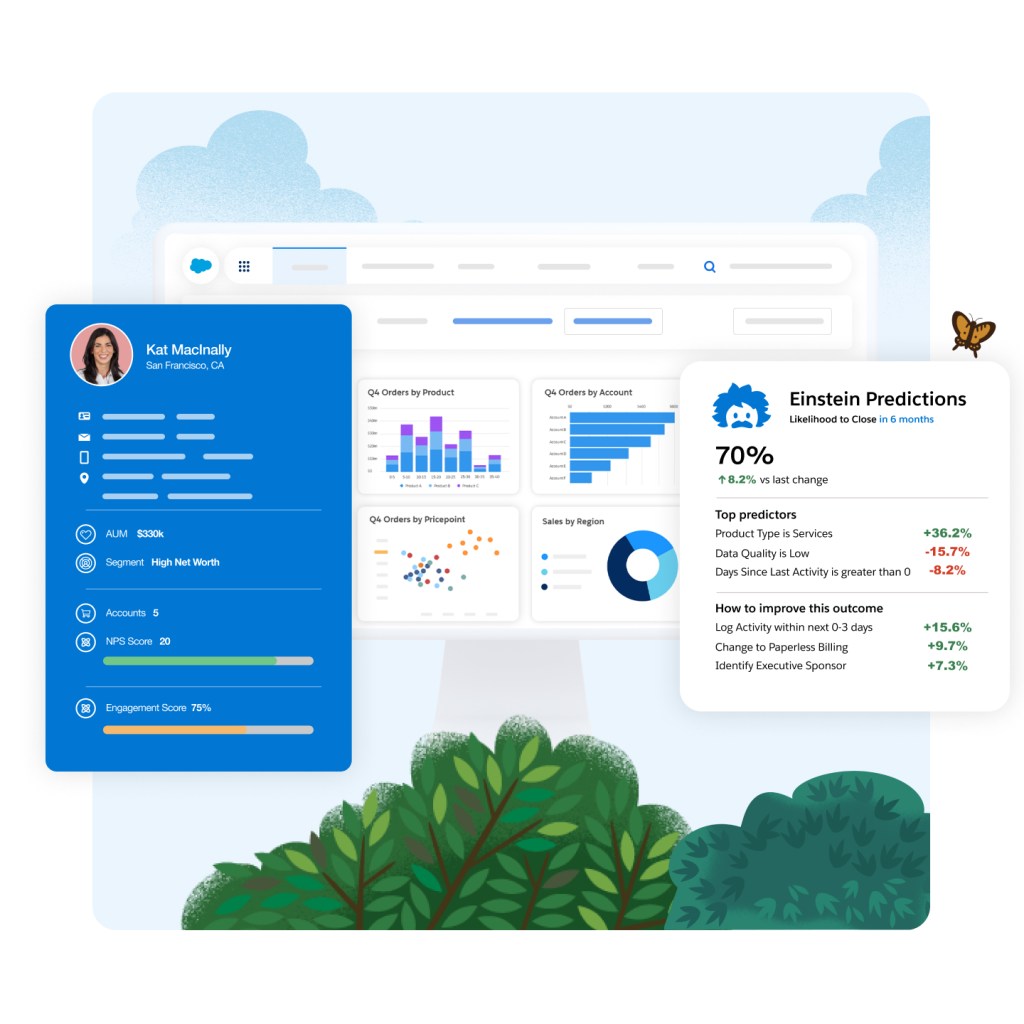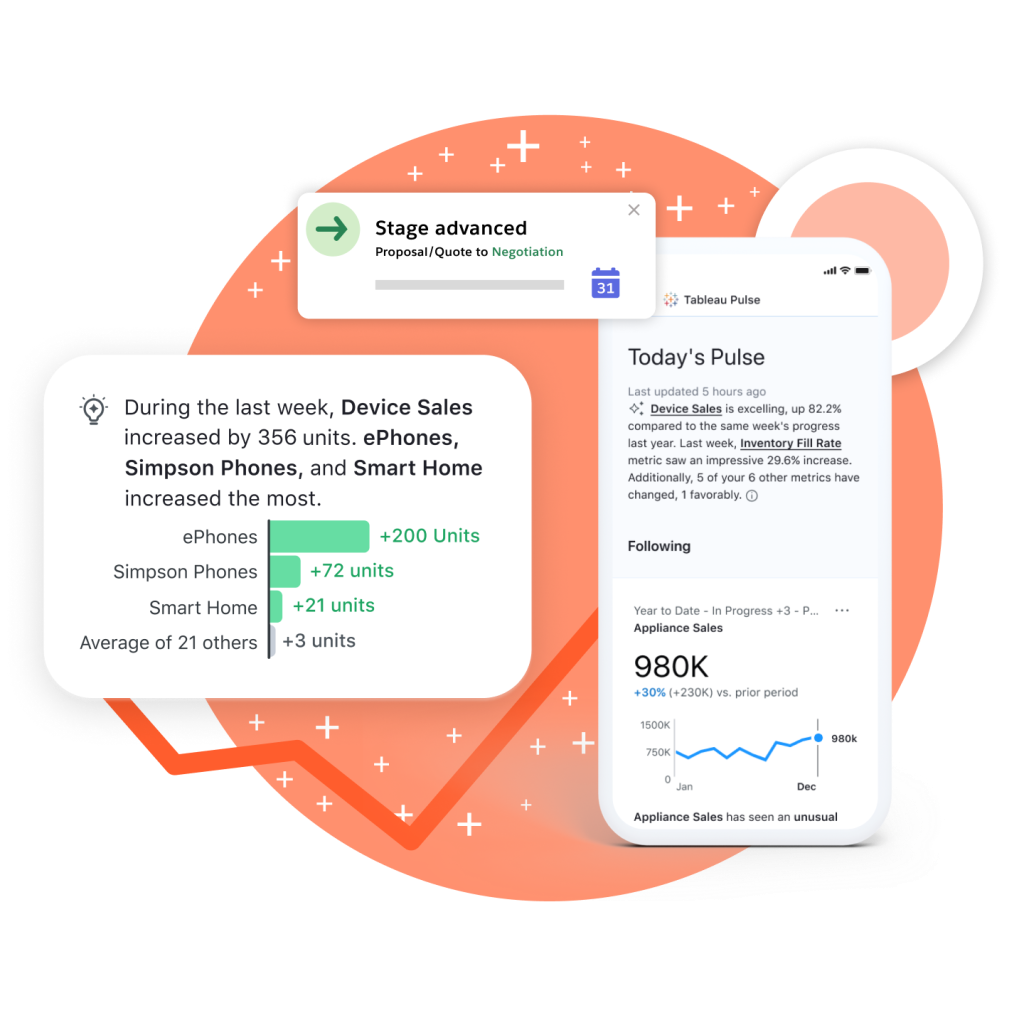
Business Intelligence
Explore insights and anticipate needs faster with business intelligence tools built directly into your CRM and Tableau. Discover the "why" behind your businesses performance and identify your next best action based on the data and insights that matter most to you.