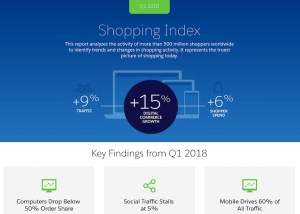


Each quarter Salesforce issues the Shopping Index, analyzing the activity of more than 500 million shoppers across the globe, and revealing the true story of what’s going on in the retail industry. In the most recent index for Q1 2018, digital turned in another strong and balanced quarter, as critical indicators—traffic, conversion, and buying intent—all pointed upward. Retailers saw healthy 15% growth in digital revenue fueled by balanced increases in both digital traffic (9%) and shopper spend (6%).

Here are some of our other findings:
Social media’s impact on ecommerce has stalled
Despite the industry hype around social media playing a critical role in driving sales over the past few years, it has actually had an insignificant impact on traffic so far. In fact, the growth of shoppers using social media channels has been essentially flat, quarter-over-quarter, since Q1 2017. For Q1 2018, social media channels represented only 4.7% of all visits to ecommerce sites and 2% of all digital orders.

Digital continues to dominate
According to the index, this quarter we witnessed balanced growth between all sub-verticals measured, with growth values ranging from 15% to 19%. Growth by vertical:
- Active Apparel: 17%
- General Apparel: 16%
- Luxury Apparel: 19%
- Health & Beauty: 15%
- Home: 18%
Mobile continues to carry traffic growth to retail sites
For the fifth consecutive quarter, mobile continues to drive traffic growth while visits from computers and tablets declined year-over-year. In fact, mobile conversion rates have grown 14%, with phones accounting for 41% of all ecommerce orders.

Discounts are sticking around
Discount rates are here to stay. The Index found that discount rates have actually increased 10% year-over-year, reaching an average rate of 21%. In addition to offering steeper discounts, retailers shipped more orders for free; 65% of all orders shipped free of charge during Q1, an 11% increase over the last two years.
As we close the books on the first quarter of 2018, we’ve learned that the critical digital commerce KPIs are healthy and balanced and mobile continues to break records. We expect to see these trends continue as we move closer to the holiday season.
For more data-driven insights, check out the entire Shopping Index, which illuminates shopping trends by analyzing the activity of more than 500 million shoppers across the globe, with a focus on key markets: the U.S., Canada, the U.K., Germany, France, Australia/New Zealand, and the Nordics. This battery of benchmarks provides rich data spanning the last nine quarters and illustrates the current state of digital commerce.