54% Of Commerce Revenue Forecasted to Be Digitally Driven by 2024 — Salesforce State of Commerce


Faced with inflationary pressures, an ongoing pandemic, and ever-shifting customer behaviors, commerce organizations and their cross-functional partners in sales, customer service, and marketing are navigating uncharted territory.
To understand how the customer landscape is shifting and practitioners are responding, Salesforce analyzed shopping behavior from websites using its Commerce Cloud platform and conducted a survey of over 4,000 global commerce professionals for its latest State of Commerce report, out today.
Here are a few key takeaways from the new report.
Digital channels are expanding to meet customer expectations
The migration of consumers and business buyers to digital channels started well before the onset of COVID-19, but the pandemic has hastened the transition. In fact, a separate study found that an estimated 60% of customer interactions now take place online, and that more than half (53%) of customers prefer to purchase over digital channels — a trend led by millennials and Gen Z.
While challenges for commerce teams abound — only 41% of survey respondents feel completely prepared to handle emerging channels — investment in channel expansion is well underway. Sixty percent of commerce professionals surveyed have adopted new channels within the past two years, and 81% are in the process of doing so now.
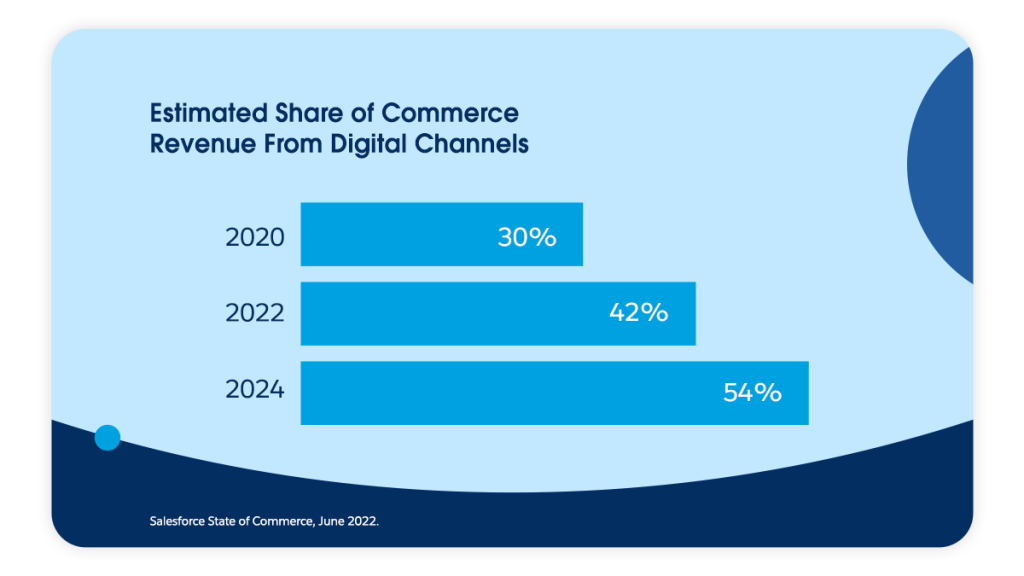
This investment is perhaps motivated by forecasts of a continued rise in digital commerce. Case in point: While an estimated 30% of commerce organizations’ revenue came from digital channels in 2020, that figure is expected to rise to 54% by 2024.
While commonly associated with consumer behavior, the migration to digital channels spans B2B and B2C — over half (52%) of revenue for organizations that sell to B2B customers is expected to be digitally driven within the next two years. Additionally, 88% of B2B sellers expect their customers to place larger, more complex orders online over the coming two years.
Third-party marketplaces such as Amazon and Alibaba are particularly popular channels for today’s commerce organizations — ranking behind only owned websites and social media. But the definition of marketplaces is expanding, too, with over one-third (37%) of commerce organizations prioritizing the implementation of their own marketplaces in which third-party goods may be sold on their own websites.
“Alternative” payment options are becoming table stakes
Payment options are aplenty. In addition to stalwarts like credit cards and bank transfers, at least half of commerce organizations accept options like PayPal, ApplePay, and payment installments (often referred to as “Buy Now Pay Later”). If forecasts hold, the vast majority of firms (nearly nine in ten) will accept such options within two years.
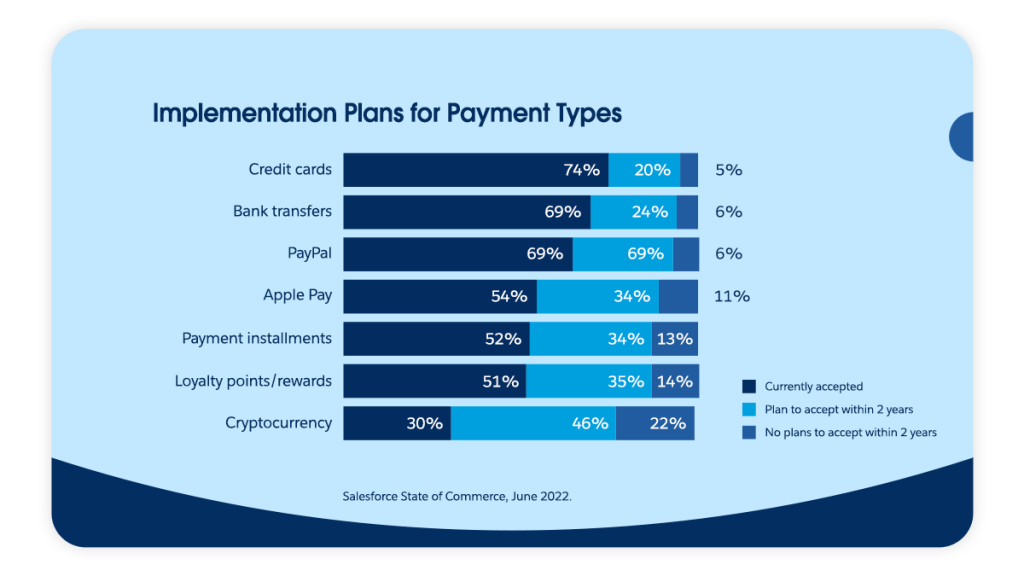
Acceptance of one of the most talked about payment vehicles — cryptocurrency — is nascent, with just 30% of organizations offering it as an option today. Yet cryptocurrencies’ role in the commerce experience is set to expand dramatically: An additional 46% of commerce organizations say they plan to accept cryptocurrencies as payment within the next two years — a higher projected rate of growth than any other payment option. Currently, organizations in India, the Netherlands, and the United Arab Emirates lead the way in their acceptance of cryptocurrencies.
Implementation of new payment options is not without its hurdles: only 40% of the commerce professionals surveyed feel completely prepared to handle new payment types. Concerns around fraud ranks as the top concern on this front, followed by the expense and time required for implementation.
The best commerce teams are focused on putting data into action
As third-party cookies are depreciated in response to regulatory shifts, commerce professionals — along with their partners in marketing — face rising challenges in meeting customer demands for highly personalized offers and communications. In fact, 88% of commerce professionals surveyed report some degree of impact by depreciation of third-party cookies on their data strategies.
In response, 36% of commerce organizations plan investments in first-party data strategies over the next two years, but plans are correlated with overall commerce performance. Forty percent of digital leaders — those who can attribute the company’s overall success to digital commerce — are planning such investments, compared to 25% of digital laggards — those who can not attribute their company’s overall success to digital commerce and do not have a high degree of success with such initiatives.
Of course, having first-party data in and of itself is not a winning strategy. Digital leaders stand apart from their digital laggard competition in their ability to put data into action. Case in point: Leaders are 1.7x more likely to be effective at using data to understand customer behavior, and 1.5x more likely to be effective at using data to inform marketing or business strategy.
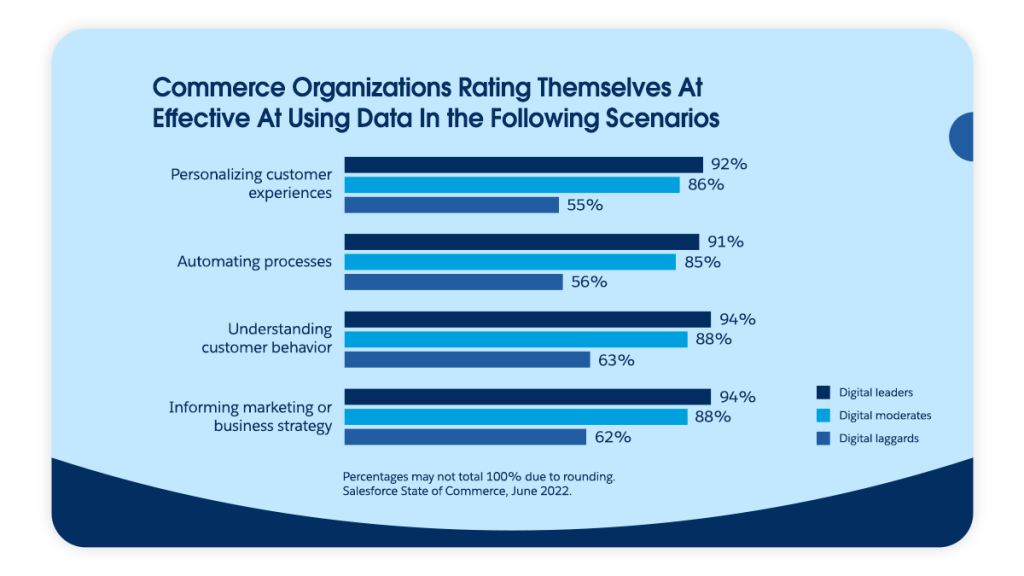
As inflationary pressures mount on firms across industries, a focus on efficiency and optimization is another focus for the most successful commerce organizations. Nearly half (45%) of commerce organizations are prioritizing process automation in the next two years. Digital leaders are ahead of the curve, being over 4x more likely than digital laggards to say they’re effective at automating processes, and 3.5x more likely to say they’re able to effectively implement an artificial intelligence strategy.
Learn more
- Explore key survey data in Tableau and read the full State of Commerce report [registration required].
Methodology
Salesforce conducted a double-blind survey of 4,102 senior B2C and B2B commerce professionals across industries through a third-party panel in February 2022 to collect practitioner insights. Respondents were sourced from Australia, Brazil, Canada, Denmark, France, Finland Germany, Hong Kong, India, Ireland, Israel, Italy, Japan, Mexico, the Netherlands, New Zealand, Singapore, South Africa, Spain, Sweden, Thailand, the United Arab Emirates, the United Kingdom, and the United States.
Additionally, Salesforce analyzed buying activity of over 1 billion shoppers across 54 countries occurring between Q1 2019 through Q1 2022 on websites operating on Salesforce Commerce Cloud. To qualify for inclusion in this analysis, sites were required to meet a monthly minimum visit and order threshold. Additional data hygiene factors were applied to ensure consistent metric calculation.
Just For You


Grow revenue everywhere with Commerce Cloud

Just For You
Grow revenue everywhere with Commerce Cloud