Organizations are under increased pressure to transform as more than 70% of their customer interactions are now digital
As digitalization accelerates, organizations could lose on average $7 million by failing to complete digital transformation initiatives
More than a quarter of business leaders now demand a company-wide API strategy to unlock data and create connected experiences
SAN FRANCISCO – February 7, 2022 – MuleSoft, provider of the world’s #1 integration and API platform, today reported that 70% of organizations struggle to provide completely connected user experiences across all channels. MuleSoft’s 2022 Connectivity Benchmark Report, released today, shows that this comes at a time when almost three-quarters (72%) of organizations” customer interactions are now digital. Yet, as digitalization accelerates, organizations could lose on average $7 million ($6,846,979) in revenue if they fail to successfully complete digital transformation initiatives.
To grow in today”s competitive environment, companies need to deliver connected digital experiences — for both customers and employees.
“In this all-digital world, customers and employees expect truly connected experiences,” said Brent Hayward, CEO, MuleSoft. “However, siloed applications and data continue to hinder customer experience and digital transformation — and it is now costing businesses millions of dollars per year. Companies need to be able to easily integrate a growing number of apps and data sources to automate their business, create seamless digital experiences, and drive growth.”

Based on a global survey of 1,050 CIOs and IT decision makers, the 2022 Connectivity Benchmark Report highlights the challenges and opportunities for organizations as they look to unlock their data to create and automate seamless experiences:
Customers expect seamless user experiences
Applications lie at the center of digital transformation and efforts to enhance the user experience. On average, organizations are using 976 individual applications (compared to 843 a year ago). Yet only 28% of these applications are integrated on average, indicating there is still an enormous opportunity to improve connected user experiences. MuleSoft’s report indicates that:
- Creating connected user experiences has become increasingly difficult: More than half (55%) of organizations said they find it difficult to integrate user experiences. This is up from 48% a year ago, showing there is increasing complexity for companies to meet their customers” digital needs.
- Overcoming security and governance challenges is a hurdle: Security and governance (54%) was cited as the biggest challenge to integrating user experiences, ahead of outdated IT infrastructure (46%) and an inability to keep up with ever-changing processes, tools, and systems (42%).
- Integrating user experience delivers business benefits: Of the organizations that have integrated user experiences, more than half said it had enhanced visibility into operations (54%) and increased customer engagement (54%). Other benefits realized included innovation (50%), improved ROI (48%), and increased automation adoption (45%).
Integration challenges hinder digital experiences and initiatives
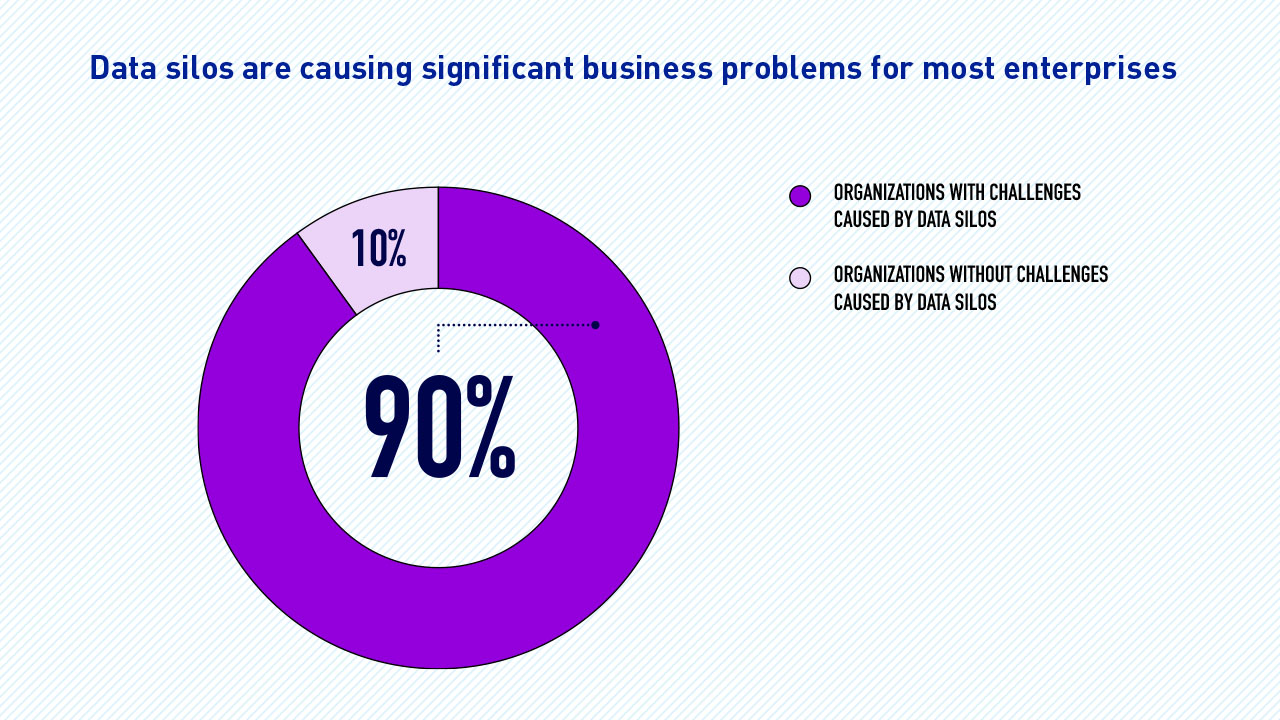
Data silos remain a significant barrier to creating integrated user experiences, with the number of organizations citing silos as a challenge (90%) remaining unchanged from a year ago. The report shows:
- Integration headaches: The biggest challenges to digital transformation are integrating siloed apps and data (38%) and risk management and compliance (37%). 88% of respondents said integration challenges continue to slow digital transformation initiatives.
- Too much is being spent on custom integration: In their efforts to integrate apps and data from across the enterprise, organizations appear to be focusing more resources in the wrong areas, such as custom integration. As a result, they are increasing their technical debt. On average, organizations spent $3.65 million* on custom integration labor in the last 12 months, a 4% increase from last year ($3.5 million).
- IT budgets are up, but so is demand: 85% of organizations said IT budgets have increased year-on-year (compared to 77% last year). At the same time, the number of projects IT is asked to deliver increased by 40% on average, a big jump from 30% a year ago. Despite the extra budget, IT is finding it difficult to meet the demands of the business. On average, more than half (52%) of projects weren’t delivered on time over the past 12 months.
Organizations turn to APIs to drive digital transformation and revenue
Despite these integration challenges, the vast majority (98%) of organizations use APIs. By using APIs to connect data and applications, organizations can digitally transform in a more sustainable manner and accelerate business success. The report indicates:
- A top down integration and API strategy: Most (90%) organizations now have a clear integration and API strategy. Over a quarter (26%) said leaders now demand that all projects abide by a company-wide API integration strategy, up from just 15% a year ago.
- Reuse is on the rise: Organizations are increasingly creating and using reusable IT assets and APIs to create new experiences and accelerate projects, rather than building from scratch each time. On average, 46% of organizations’ internal software assets and components are available for developers to reuse — an increase from 42% a year ago. Nearly half (48%) of organizations said IT is actively reusing these components, versus 41% in the 2021 report.
- Empowerment of business users: Enabling non-technical users to harness low-code tools to drive their own automation and digital transformation projects can take huge pressure off IT teams. More than half (55%) of organizations now have a ‘very mature’ or ‘mature’ strategy to empower these users to integrate apps and data sources powered by APIs (compared to 36% last year).
- APIs drive revenue: Two-fifths (40%) of organizations said they have experienced revenue growth as a direct result of leveraging APIs (compared to 28% a year ago).

“Digital agility is essential to successful transformation, allowing organizations to drive innovation at scale, deliver new initiatives faster, and create the experiences that customers want,” said Kurt Anderson, managing director and API transformation leader, Deloitte Consulting LLP. “A modern strategy that combines integration, API management, and automation is central to achieving digital agility. It enables organizations to easily connect and integrate their data, applications, and devices to create new digital capabilities and drive transformation projects.”
The 2022 Connectivity Benchmark Report is created in collaboration with Deloitte Digital, who together with MuleSoft, can help IT organizations across industries meet the continuously evolving demand to connect data and create transformation opportunities for the business. To read MuleSoft’s full 2022 Connectivity Benchmark Report, download it here.
Methodology
For the seventh-annual Connectivity Benchmark Report, MuleSoft, in partnership with Vanson Bourne, surveyed 1,050 IT leaders from global enterprises. The goal was to uncover how much value businesses actually gain from digital transformation, and to understand IT leaders’ most successful strategies for achieving digital transformation goals. The online survey was conducted between October 2021 and November 2021 across the United States, the United Kingdom, France, Germany, the Netherlands, Australia, Singapore, Hong Kong, and Japan. Only suitable candidates participated in the survey and were verified by using a rigorous, multi-level screening process. All respondents work at an enterprise organization in the public or private sector with at least 1,000 employees and hold a managerial position or above in an IT department.
*Survey respondents stated on average they spent $9,491,188 on IT staff (both on employee salaries and external contractors) over the last 12 months.
Cumulatively survey respondents stated on average their IT teams were spending 38.46% of their time designing, building, and testing custom integrations.
2022: $9,491,188 x 38.46% = $3,650,311
2021: $9,870,901 x 35.55% = $3,509,105
About MuleSoft, a Salesforce company
MuleSoft, provider of the world’s #1 trusted integration and API platform, empowers any company to quickly unlock and integrate their apps and data to create seamless experiences, faster. For more information, visit: https://www.mulesoft.com.
MuleSoft is a registered trademark of MuleSoft, Inc., a Salesforce company. All other marks are those of respective owners.


About Salesforce
Salesforce is the #1 AI CRM, empowering companies to connect with their customers in a whole new way through the power of CRM + AI + Data + Trust on one unified platform: Einstein 1. For more information visit: www.salesforce.com.
Any unreleased services or features referenced in this or other press releases or public statements are not currently available and may not be delivered on time or at all. Customers who purchase Salesforce applications should make their purchase decisions based upon features that are currently available. Salesforce has headquarters in San Francisco, with offices in Europe and Asia, and trades on the New York Stock Exchange under the ticker symbol "CRM." For more information please visit https://www.salesforce.com, or call 1-800-NO-SOFTWARE.
Related Articles


Get the latest Salesforce News