

With resources and data spread across more teams and systems than ever before, effective project management has never been more essential. But it’s also never been more challenging.
A recent McKinsey & Company survey of senior project executives found that, on average, projects overrun their budgets and schedules by 30–45%. Sophisticated tech stacks, complex AI initiatives, and increasingly global teams mean static spreadsheets and lists no longer cut it. Teams need agility and visibility to stay aligned and deliver outcomes consistently.
This is where Gantt charts can help. These visual project management solutions let teams track progress, collaborate, and view timelines and deliverables at a glance. In this guide, we’ll explain how they work and how you can use them for smarter project delivery in 2026.
What you’ll learn
- What is a Gantt chart?
- Key components of a Gantt chart
- How Gantt charts are used
- When to use a Gantt chart (and when not to)
- How to make a Gantt chart
- Tool-by-tool Gantt chart guides
- Level up your Gantt charts with Salesforce
- Building an eCommerce Gantt chart (step-by-step guide)
- Gantt chart examples in different industries
- Gantt chart troubleshooting and common pitfalls
- Summing up
- FAQs
Surface insights directly within your project timeline with Salesforce AI
Salesforce AI delivers trusted, extensible AI grounded in the fabric of our Agentforce 360 Platform. Utilise our AI in your customer data to create customisable, predictive and generative AI experiences to fit all your business needs safely.


What is a Gantt chart?
A Gantt chart is a project management tool that provides a visual timeline of a project. It allows teams to view upcoming tasks and track progress towards milestones over time. It also lets managers set clear priorities and responsibilities to keep every project running smoothly.

Ultimately, the purpose of a Gantt chart is to ensure every team member knows what to do and how their work fits into the overall project timeline. This encourages agile planning, better task scheduling, and project collaboration, helping teams track progress and work towards goals with clarity.
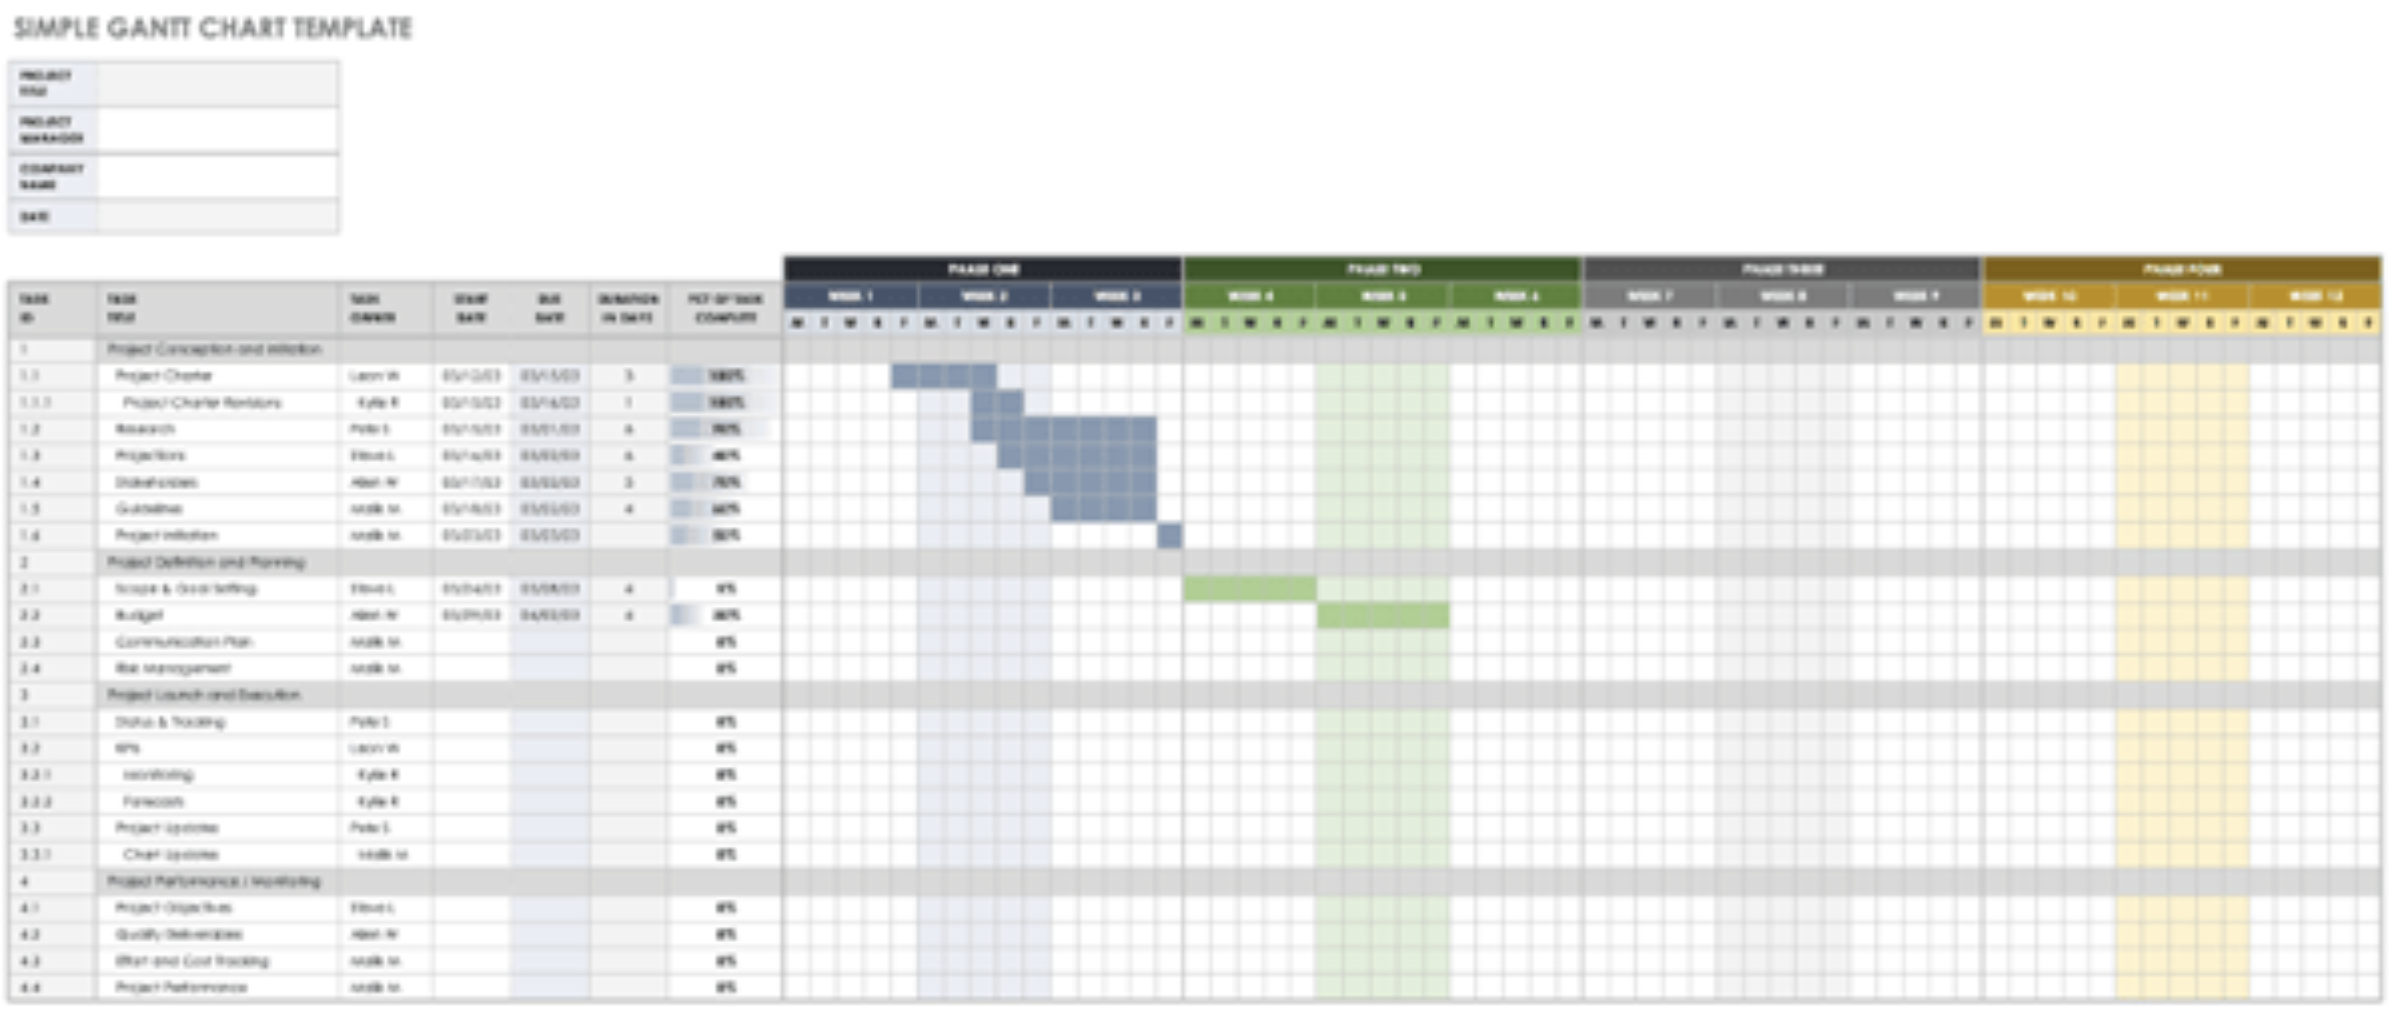
Key components of a Gantt chart
Fundamentally, a Gantt chart tracks a project’s progress over time. To explain how this works, let’s explore the components in more detail.

- Task list: Every Gantt chart has a list of tasks that must be completed for a project to be successful. For example, you might see a list with tasks such as ‘design a landing page’, ‘write five blog posts’, and ‘send out emails to stakeholders’.
- Timeline: Gantt charts also contain dates and times on the horizontal axis. This lets you track the project’s overall progress and see when a given task is scheduled to begin and end.
- Task bars: You’ll also notice that each task has a ‘progress bar’ of varying length. This indicates each task’s start and end date and its overall duration; the longer the bar, the more time and resources that task has allocated.
- Dependencies: Gantt charts also specify which tasks are dependent on each other by connecting them with arrows. This ensures tasks are completed in a logical order. For instance, there’s no use uploading blogs until you’ve designed your site.
- Milestones: Most project managers will set milestones that signify achievements, such as reaching the halfway point of a project or completing a key element with many dependencies. These are usually indicated on the chart with a diamond.
- Today line: A vertical line running through the chart marks the current date. This makes it easy to see whether the project, and its individual tasks, are on schedule or falling behind.
- Resources/assignees: Within each task bar, project managers can specify the resources required to complete a specific objective, such as the team members, raw materials and equipment. This provides a clearer view of the project’s scope.
- Critical path: This is the longest path (in time) from the start of the project to the finish. It gives an indication of the minimum length of time it will take to complete the project.
Together, these elements create a simple but effective framework for tracking and delivering projects on time and within scope.
AI Built for Business
Enterprise AI built directly into your CRM. Maximise productivity across your entire organisation by bringing business AI to every app, user and workflow. Empower users to deliver more impactful customer experiences in sales, service, commerce and more with personalised AI assistance.
How Gantt charts are used
An effective Gantt chart makes it easier to align tasks, timelines and teams, giving them a wide range of use cases. Here are five applications to consider.
Gantt Chart Examples
| Application | How Gantt charts help | Example |
|---|---|---|
| Project visibility | Surfaces the whole body of work at a glance so teams can align on scope and timing without tedious project status meetings. | A marketing team sees all campaign deliverables on one timeline, making it easy to coordinate deadlines. |
| Progress tracking | Shows timelines, tasks, and dependencies for a clear view of overall progress and individual performance. | A software development manager tracks feature completion across sprints, spotting potential delays early. |
| Allocating resources | Reveals high-priority tasks and over/underutilised workers, helping managers allocate resources and people more efficiently. | A project management lead reallocates team members from a low-priority project to a delayed milestone to meet a key deadline. |
| Cross-team collaboration | Creates a single source of truth for all teams, reducing misunderstandings around project deliverables and scope. | Sales, marketing, and product teams use the same chart to coordinate a product launch and speed up handoffs. |
| Timely delivery | Highlights critical paths, dependencies and resources, helping teams prioritise proactively to stay on track. | A product manager spots that QA approvals are on the critical path, so they adjust internal deadlines to keep the launch on schedule. |
When to use a Gantt chart (and when not to)
A Gantt chart is a powerful project visualisation tool, but it isn’t ideal for every situation. Here’s an overview of when to use one and when an alternative may be better.
You should use a Gantt chart when:
- You’re handling complex, long-term projects with multiple interconnected tasks.
- Tasks have clear deadlines and dependencies that impact overall project timelines.
- The project spans multiple departments, each with its own responsibilities.
- You need full visibility across teams to keep everyone aligned.
On the flipside, a Gantt chart might not be right for you if:
- You have a simple and short-term project with a limited number of tasks.
- Tasks have no fixed deadlines and limited interdependencies.
- You want the focus of your task to be on outcomes rather than timelines.
The last point is particularly important here. While Gantt charts are a vital tool for timely turnarounds, they may fall short when end quality is more important than deadlines, such as in brainstorming or discovery tasks. In this case, a more flexible approach is often more effective.
How to make a Gantt chart
With the basics out of the way, let’s discuss how to make a Gantt chart, step by step.

Step 1: Define the project scope
First, you need to understand the scope of your project. Consider these questions:
- What is the end goal of your project?
- What are the key deliverables?
- What resources and teams do you have available?
- When will the project start?
Communicate with key stakeholders to get an answer to each of these queries, and use the answers to lay the foundation for your overall project.
Expert tip: Make sure all stakeholders are aligned on clear, measurable goals before you begin the next step. Use the SMART framework to help with this process.
Step 2: Identify tasks and subtasks
Based on your end goal and deliverables, identify all of the granular tasks and activities you’ll need to complete within your project. For instance, if a key deliverable is to build a website for your business, you could break down this into tasks such as:
- Develop and code the website.
- Test for functionality and responsiveness.
- Create wireframes and page layouts.
- Write website copy for each page.
Each of these tasks can then be divided into subtasks. For example, developing the website might involve setting up a dev environment, coding back-end functionality and integrating third-party tools. The more detail you can produce here, the more realistic and achievable your Gantt chart will be.
Expert tip: Colour-code tasks into groups based on teams, project phases, or delivery types so they’re easier to identify.
Step 3: Decide on time ranges
Next, identify how long each task and subtask could take based on its complexity, resource needs and the level of skill required. You should work in collaboration with your teams here to develop an accurate picture.
If your project has fixed start and end dates, you may need to adjust these time ranges later to ensure everything can be completed within the overall project timeline.
Expert tip: It’s a good idea to allow some flexibility in your time scale at this stage. Delays are often unavoidable, so it’s best to bake this into your scheduling ahead of time.
Step 4: Identify dependencies
Which tasks will need to be completed before other tasks can begin? For instance, you can’t upload a blog to your website until the writer creates that blog, and you can’t write the blog until you’ve performed keyword research.
Piece together all of these dependencies to identify which tasks are higher and lower priority.
Expert tip: Flag high dependency or critical path tasks early, as these tasks can impact multiple other tasks if they’re delayed. They’ll need to be prioritised during your project’s schedule.
Step 5: Arrange your Gantt chart
With knowledge of what each subtask is, how long each will take, and what order they need to be completed in, you’re ready to assemble your chart.
Start by plotting each task and subtask on a visual timeline, using bars to represent their start and end dates. Include dependent-heavy tasks listed earlier in the overall project timeline. You can then connect key tasks to dependencies using arrows or lines for clarity.
From there, assign tasks to the appropriate team members. Take care to balance workloads to avoid overutilising or underutilising different individuals.
Expert tip: If your project has a fixed end date, begin with the final task and work backwards to figure out whether your time ranges need to be tweaked to accommodate the deadline.
Step 6: Add project milestones
Setting key milestones isn’t always necessary, but they can be useful for goal setting and keeping the project on track. They will act as checkpoints that you can use to define project phases and motivate your team.
You can mark these in your Gantt chart at the appropriate point by using a diamond symbol so they’re clearly identifiable.
Expert tip: Milestones are subjective. For example, you might set a milestone when a website is complete, week-by-week as a mid-phase check-in, or at the physical halfway point of your project. It all depends on your priorities and the breadth of your project.
Step 7: Refine and adapt
Gantt charts are rarely static. Plans might change, so it’s important to review and refine your project management tool on a weekly or monthly basis. If a deadline becomes unachievable, you may choose to adjust timelines, re-prioritise tasks or allocate another team member to the project temporarily to ensure everything stays on track.
Expert tip: Communicate any changes to your Gantt chart to all teams, not just those working on the subtask. Online Gantt charts work best when teams have an overview of the project as a whole, not just tasks in isolation.
Tool-by-tool Gantt chart guides
There are three default tools most project managers use to build Gantt Charts: Excel, PowerPoint and Google Sheets. Let’s take a look at the benefits of each.
Gantt Chart Tools
| Solution | Best for |
|---|---|
| Excel | Analysts who need offline, simple Gantt charts for individual projects or small teams |
| PowerPoint | Executives who need to make static visual timelines for presentations, pitches, and stakeholder sign-offs |
| Google Sheets | Collaborative teams requiring real-time updates and easy sharing between remote/hybrid workers |
How to create a project Gantt chart in Excel
Unless you’re using specialist software, the standard way to create a Gantt chart for free is in Excel. The software’s natural grid lends itself to this kind of chart. Here’s how it could look:
Start by listing all of your tasks in a table. Also, define the start dates, end dates and duration. From there, highlight the table, click Insert and select a Stacked Bar Chart. You can then adapt and format the data on this table to meet your business’s requirements.
How to create a Gantt chart in PowerPoint
As with Excel, PowerPoint doesn’t have a specific Gantt chart feature. That said, the platform’s Stacked Bar feature is a viable alternative.

Go to the Insert tab and click Chart. Then, select the Bar category from the All Charts list. Finally, select Stacked Bar.
From here, you can edit the table with your own data, such as the project list, start date, end date and duration. You can also easily move the taskbars to adjust their length according to your project plan.
How to create a Gantt chart in Google Sheets
The Google Sheets chart is easy to make, but it offers less customisation, so we recommend it only if you’re just starting and want something easy.
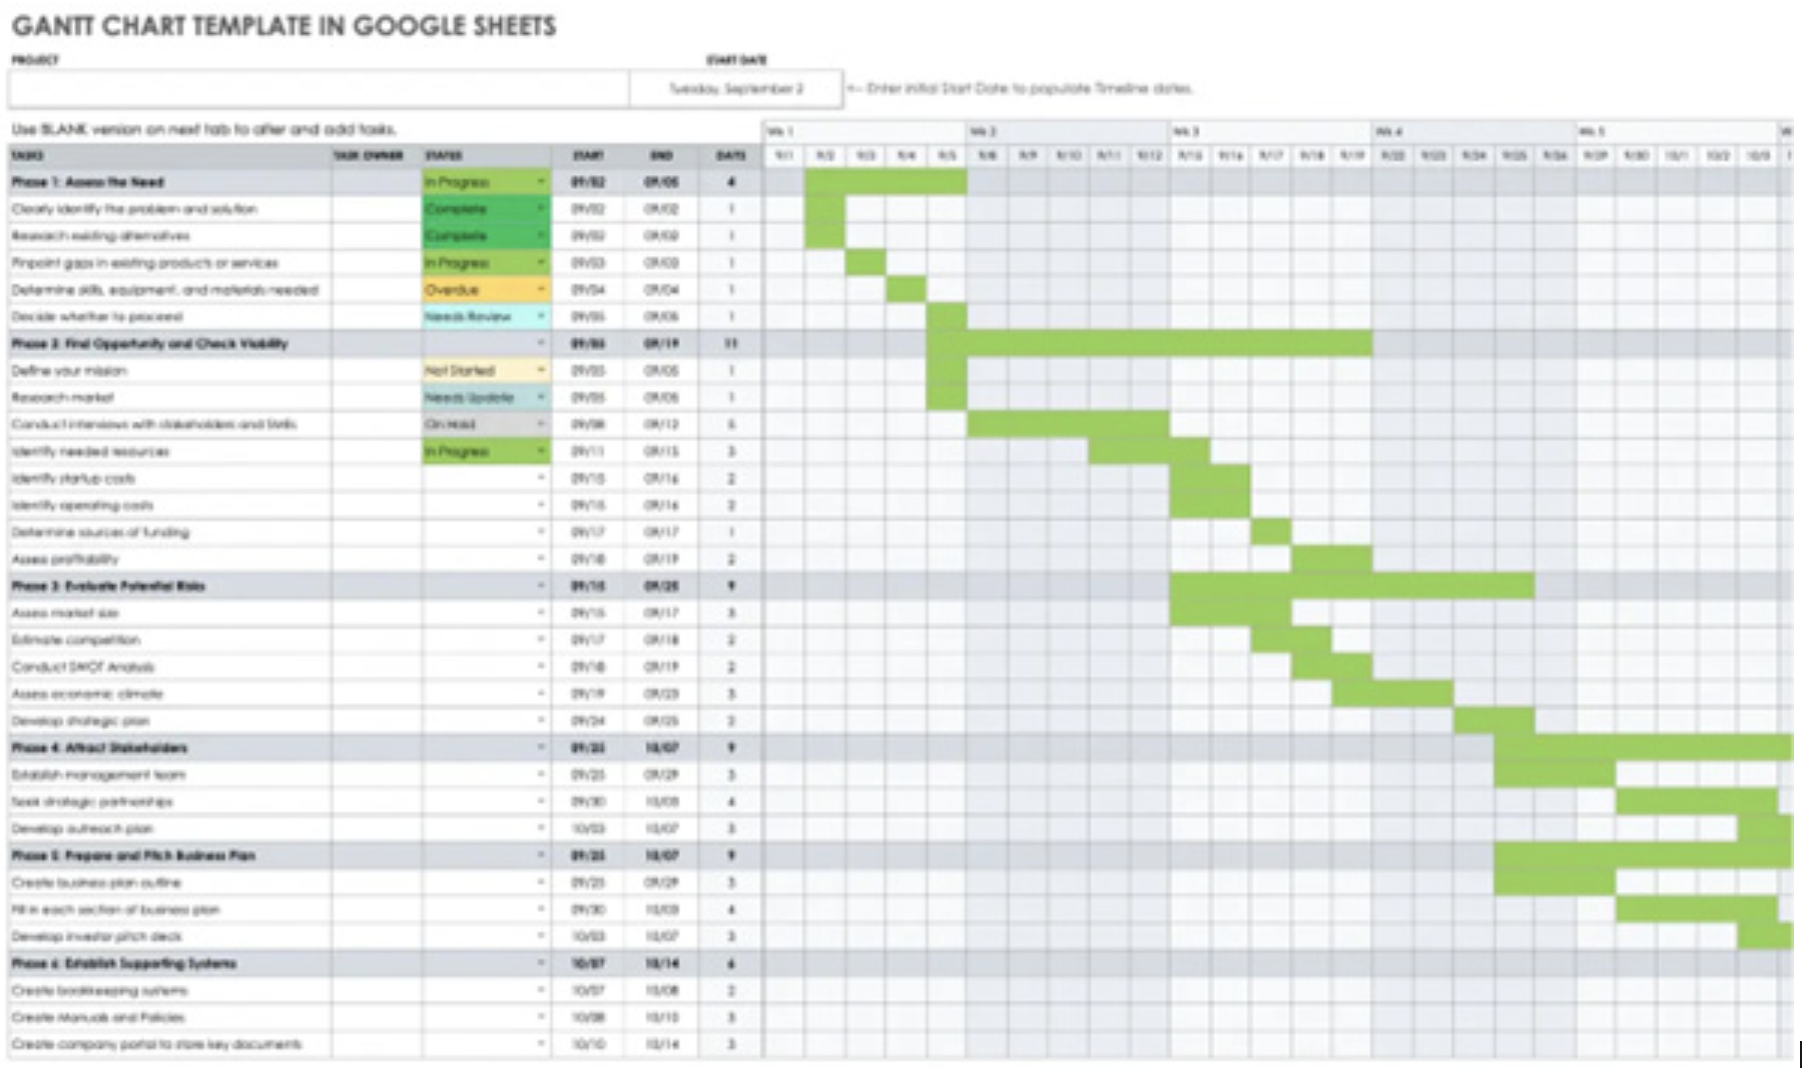
As with Excel, you can create a table with your data. Then, insert a stacked bar chart and edit it to your preferences.
Applying a Gantt chart in practice: eCommerce example
To show you how building a Gantt chart could look in practice, let’s create one for an imaginary company. Here’s a step-by-step Gantt chart example for an eCommerce business.
Defining the scope for our Gantt chart
First, we need to define the scope. We want to build our website and drum up interest for our product online. After assessing our budget, we’ve determined we have around six months to achieve this goal. We also know several key phases need to take shape for us to reach that objective:
- Website development
- Product photography
- Content creation
- Pre-launch marketing
We now know that our Gantt chart will span six months. We also have five key phases to help us launch, market, and sell our products to a large audience. Let’s move on to the next step.
Adding our tasks to the Gantt chart
Next, we need to break down all of our phases into tasks. What needs to take place for each stage of our project to be successful? We should also liaise with our team to determine how long each task will take (task duration). Here’s what we came up with:
| Website Development |
|---|
| Task | Duration |
| Hire a web developer | 5 days |
| Code the website | 60 days |
| Design a homepage | 15 days |
| Build our product pages | 5 days |
| Conduct tests | 7 days |
| Product Photography |
|---|
| Task | Duration |
| Source an expert photographer | 7 days |
| Organise a photoshoot | 14 days |
| Edit the photos | 21 days |
| Upload product images to our website | 3 days |
| Pre-Launch Marketing |
|---|
| Task | Duration |
| Conduct audience research to find our target customers | 20 days |
| Set up and optimise social media profiles | 3 days |
| Create an ebook to use as a lead magnet | 15 days |
| Develop a tailored email marketing campaign | 30 days |
| Identify the best channels for social media ads | 20 days |
| Content Creation |
|---|
| Task | Duration |
| Create a buyer persona | 14 days |
| Perform keyword research | 7 days |
| Create 20 potential blog titles | 5 days |
| Create first drafts | 30 days |
| Refine and improve to create the final articles | 20 days |
Now we’re getting somewhere. In addition to determining the tasks, we need to consider all of the project resources required for each of these steps. Which team members will complete each task? What tools and equipment do you require? The more detailed you can be, the easier it will be to align your organisation with the project.
Establish our dependencies
We now have our list of tasks, but we must consider dependencies before constructing our chart. Here are some examples of what that might look like:
- The website development phase should begin immediately. That’s the number one priority.
- We can start product photography immediately, but we can’t upload any images to our website until we’ve created our product pages.
- We can’t create a buyer persona until we learn more about our target customers, so content creation will have to wait.
- There’s little use in starting a pre-launch marketing strategy if we have no website to direct customers to.
- We’d like some content on our website before posting on social media.
Establishing dependencies helps us piece together the puzzle. By completing this process thoroughly, we can build a timeline that will be the foundation of our chart.
Building our chart
With all of the information ready, we can now use our chosen tool to create a Gantt chart for our business. We’ll need to include all essential details, such as:
- Task details
- Start-to-finish dates
- Task progress bars
- Milestones for key phases
- Resources for each section
- Dependencies
And that’s all there is to it. We’ve now created a functional Gantt chart for our imaginary eCommerce business. All that’s left to do is track our progress and refine the chart over time. Delays are likely to happen, but as long as we adjust our project, we can keep our team aligned and everyone moving toward the goal.
Gantt chart examples in different industries
To show you how Gantt charts can be adapted for different sectors, here are five industries and how they can utilise this tool to improve their organisational efficiency.
Construction Gantt chart
Construction projects are closely controlled, with many tight deadlines and individual responsibilities. When you’re building a house, for instance, installing HVAC equipment is of little use until the electrics are installed, and the electrics can’t be installed until the foundation is complete.
As such, Gantt charts are vital for construction project scheduling. Here’s an example that shows all the steps involved in applying for permits, conducting feasibility studies, hiring crew, preparing for construction and beginning the final project.

Software development Gantt chart
Gantt charts are commonplace within agile project management frameworks in software development. They help with sprint planning and organising coding, testing, bug fixing and deployment into clear time blocks.
Coding is filled with tight deadlines and upcoming release schedules. The Gantt chart helps every software developer stay on top of their daily tasks and work efficiently. In the example below, the project manager also allows time for quarterly meetings and stakeholder discussions.

Marketing Gantt chart
Gantt charts are helpful tools for marketing project planning. Marketers can also use them for content calendars and product launches, as well as for scheduling serial blogs or social media posts.
This example shows how ClickUp has used a Gantt chart to schedule several marketing campaigns. Some campaigns are seasonal, meaning they fall later in the chart. Others, like the ‘Be You’ campaign, depend on previous campaigns, so they must be implemented later.

Manufacturing Gantt chart
Production scheduling is a huge undertaking in the manufacturing industry. Even the smallest deviation can greatly impact profit margins. Simple Gantt charts ensure that product development follows a clear timeline. This also helps with material tracking and inventory management.
In the Gantt chart template below, you’ll notice how the manufacturing Gantt chart commonly follows a much more linear structure from development to post-production. This is because product roadmaps are sequential.

Healthcare Gantt chart
Gantt charts are helpful for everything from broad clinical trials and treatment phases to individual patient care planning. They’re particularly useful when you need to schedule long-term treatment plans, where providing the correct dosage at the right time is essential.
Below is a unique example of how a Gantt chart can help a team implement electronic health records (EHR) in a healthcare business.

Gantt chart troubleshooting and common pitfalls
Finally, let’s discuss some common problems you might encounter when you design and customise your Gantt charts. We’ll also provide some solutions for each.
1. Scope creep
Problem: As your Gantt chart project grows in size and scale, there’s a tendency for additional tasks to crop up that you hadn’t considered initially. This can make it more difficult for your team to stay on time and on budget.
Solution: The best way to manage scope creep is to catch it before it happens. Ensure your list of tasks and dependencies is comprehensive and outline your goals before it starts. The more you prepare, the less likely you’ll be to encounter surprises. If scope creep does occur, review and adjust your Gantt chart tool and communicate with your team to redefine expectations.
2. Resource constraints
Problem: Managing resources is almost always a talking point when undertaking a large project. If you run out of available team members or money, this can cause delays.
Solution: Include a resource management and allocation plan for your Gantt chart. This will let you set expectations with stakeholders early. If resources are limited from the outset, you might need to stagger your chart and extend the project timeline to avoid spreading your staff and equipment too thin.
3. Inaccurately defined task dependencies
Problem: Dependencies are essential for your project’s success. For example, if you have a team member write copy for a homepage before the website is built and the content ultimately doesn’t align with the design, you can run into serious delays.
Solution: The best course here is to be thorough when setting up your chart. We also recommend implementing short buffer periods between essential tasks to leave enough room for potential delays.
4. Lack of maintenance
Problem: Gantt charts aren’t static. Neglecting them and allowing deadlines to pass without updating your chart will lead to outdated information, costly delays and confusion among your team.
Solution: Review and update your Gantt chart regularly during your work week. If you aren’t available, assign someone else to track progress. Where possible, you should also choose Gantt chart software that provides notifications when a deadline approaches or is missed.
Level up your Gantt charts with Salesforce
While it’s possible to create an Excel Gantt chart, that doesn’t mean it’s efficient. With the Salesforce AppExchange, you can browse through several innovative apps that make creating professional Gantt charts from scratch easier.
For instance, Mission Control will help you plan, design and manage every aspect of your project management Gantt chart. Simply enter all essential data, and the app will do the rest to make every aspect of your project management on Salesforce easier.
The best part about apps like Mission Control is that they integrate seamlessly with the Salesforce platform, meaning every task, milestone, and dependency can be connected to real-time data from your CRM. This gives every stakeholder real-time visibility of project progress, performance and priorities, all without manually updating the chart each day.
And, with the help of Salesforce AI and Agentforce, you can surface insights directly within your project timeline. If there’s a task at risk of falling behind, our agentic AI solution can identify it automatically, recommend resource allocations to reduce bottlenecks and solve the problem before it impacts delivery, freeing up more time for deep strategic work.
Essentially, this turns your Gantt chart from a visual timeline into a living document powered by intelligent automations, ensuring every project is optimised, on time and aligned with your business goals. Take a closer look at Salesforce’s AI for Business solutions.
Experience Salesforce with an interactive demo.
Get hands on with our products and explore real use cases and solutions built for agentic enterprises.
Summing up
Gantt charts organise and streamline projects, allowing you to meet deadlines and align your entire team on common goals. They’re one of the most effective ways to get things done, regardless of your industry.
Ready to start making your own Gantt chart to streamline your next project? Use the guidance above as a starting point. Then, choose your preferred Gantt tool and start building.
With the Salesforce AppExchange, you can integrate an outstanding Gantt chart app directly into the Salesforce platform. From there, you’ll benefit from real-time data and advanced analytics through Salesforce AI to uncover issues before they arise, optimise resources, and keep every project on track. Watch the Salesforce AI demo today to learn more.
FAQs
Is the Gantt chart a new concept?
Gantt charts have existed in some form for almost 130 years. Karol Adamiecki, a Polish engineer, designed a pioneering version of the tool in 1896, naming it the ‘harmonogram’. By 1910, Henry Gantt had independently created his own version of the Gantt chart in the United States. Initially, he designed it to track factory workers’ time on different tasks.
Modern Gantt charts combine Gantt and Adamiecki’s designs. Today, we use the chart for project management purposes rather than tracking factory workers.
How does a Gantt chart compare to a work breakdown structure?
A work breakdown structure (WBS) is used to define and organise a project’s scope by breaking it down into smaller components like phases, tasks and subtasks. Essentially, it helps you track what to do.
By contrast, a Gantt Chart is used to visualise and manage the timeline of those tasks. It shows when each activity starts and ends, as well as how tasks link with each other. It shows you when and how tasks get done, making it best for complex projects with multiple interdependencies.
How do I keep my Gantt board from looking cluttered?
The best way to keep things streamlined is to colour-code subtasks and tasks based on their phase in the project, the teams that will work on them or the type of task they are. You can then implement filtered views for different colours to ensure it’s easy to find the information you need at a glance.