
Tableau deployed its own agentic analytics system internally (as “Customer Zero”) to tens of thousands of our own Salesforce employees, before asking any customer to do the same. What we discovered shaped everything about how we built the product.
As enterprise data architectures scale, putting a capable analytics agent in every employee’s pocket isn’t a data access problem — it’s a governance and trust problem. In this post, we’ll share the four-part framework we developed to achieve accuracy, strict governance, operational visibility, and predictable costs at scale.
Inside Customer Zero: Deploying agentic analytics across Salesforce
Our sales teams needed fast, accurate answers about their accounts, pipeline, and deals, every morning, on the go, without waiting on an analyst. It’s the most common analytics need in any large enterprise: “How am I doing, what changed, and what should I do about it?” The gap was never a lack of data. It was getting a trustworthy answer.
We found people want that trust delivered three ways: sent to them proactively when something changes, visualized so they can see the whole business in one shot, and conversational so they can ask a follow-up in plain language. All three only work if they’re grounded in the same governed source of truth.
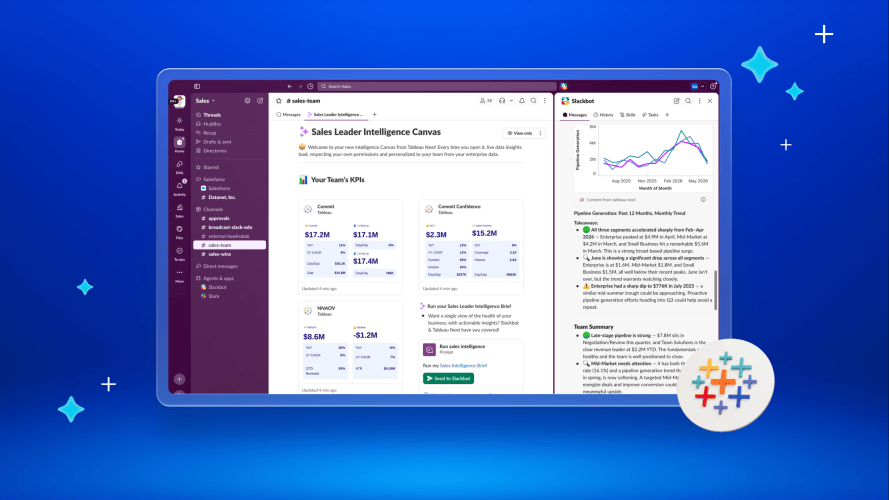
We kept the architecture simple, and built it entirely on components our customers can use too: Slack as the front door and Slackbot Skills as the connective tissue, packaging workflows (a proactive daily brief, dashboards rendered directly in Slack, and freeform Q&A) so the agent answers like a good analyst would.
Under the hood, those skills route to whichever engine has the governed answer: Tableau Next MCP for Tableau Next semantic models, or Tableau MCP for Tableau Cloud and Server. This architectural flexibility means any organization, regardless of whether they deploy on Tableau Cloud, Server, or Tableau Next, can implement the exact same pattern today.
Tableau Semantics on Trailhead


Without a semantic model to serve as an authoritative source of truth, interpreting those core business concepts was left entirely to the LLM at runtime. This forced the agent to infer meaning and guess the definitions of terms like “pipeline,” “coverage,” or “win rate.” Without semantic grounding, the agent was only 30-45% accurate — and a confident wrong answer is hard to catch.
The unlock wasn’t a better model; it was a governed source of truth. We introduced semantic models, business preferences, and verified Q&A on top, so “pipeline,” “ACV,” “coverage,” and “current quarter” each resolved to an approved definition. This “know-how” is what we now call Tableau Knowledge.
The result: structured evaluations of 200+ real user questions, run in multiple rounds, drove pre-launch accuracy above 85%. More important than the number, reps trusted the answers and analysts stopped fielding repeat questions.
Solving the 4 critical challenges every data leader faces with agentic analytics
As we were rolling this out to our organization, we were simultaneously having these discussions with customers walking the same road. Four questions came up again and again. They aren’t edge cases — they’re the core architecture decisions of any agentic analytics deployment.
1. Semantic governance: “How do we make sure everyone is working from the same definitions?”
Take a question as ordinary as “What’s my open pipeline this quarter?” Without governed definitions, the agent has to guess at every term:
- “Pipeline” — Every open opportunity, or only qualified ones?
- “This quarter” — Calendar or fiscal? And on the first Monday of a new one, which quarter did the user mean?
- “My” — The deals I own, or everything under me in the hierarchy?
Ask the agent the same question on two different days, and you may get different answers. This can be a strength for open-ended language, but a liability for business metrics, where “probably” isn’t good enough. At scale, every metric that matters (pipeline, coverage, ACV, win rate) quietly forks into a dozen private definitions.
Tableau’s answer is the semantic layer coupled with business know-how to provide a single source of truth and organizational specific knowledge. The semantic model, business preferences, and verified Q&A encode approved metric definitions, dimensions, and business rules, so every query resolves to a consistent, governed answer specific to our (or your) business jargon — no matter who asks, how they phrase it, or which surface (dashboard, brief, or chat) they’re asking from.
Here’s what we actually did for Customer Zero:
- Built a semantic model that pinned down our key metrics and the dimensions sellers slice them by: commit, coverage, open pipe, velocity — along with the messier stuff that actually breaks agents in practice, like deduplication logic and fiscal-period resolution, so “current quarter” resolves correctly even on the first day of a new one.
- Appended knowledge (business preferences and verified Q&A) to the semantic model, to give it the context of our specific business jargon. For example, AOV at Salesforce stands for Annual Operating Volume. It stands for Average Order Value at other companies. When we say “how is my team’s performance this quarter?” we mean how are they doing on ACV and NNAOV.
- Maintained a living reference spec. Every new skill or workflow built against this data has to call the same pre-vetted, pre-approved calculations (like core KPIs, historical snapshots, week-over-week deltas, deal-movement flags) rather than reinventing the math each time. That’s the actual mechanism that keeps every workflow and every persona answering the same question the same way.
- Aligned the AI layer to the dashboard layer by design, not by accident. Some metrics live natively in the dashboard; the AI-facing layer is deliberately routed through the same governed semantic model version. A seller asking Slackbot a question and a seller opening the dashboard see the same numbers, defined the same way — because both paths were built to converge, not because they happened to.
- Kept it inside the enterprise perimeter. Because this runs against governed, internal semantic models rather than pasting business data into a general-purpose AI tool, sensitive data never has to leave the security boundary to get an answer — a meaningfully different trust posture for a CIO or CDO evaluating this at scale.
This is the difference between agentic analytics that looks smart in a demo and analytics you can actually act on.
2. Content governance: “How do we govern AI-generated content?”
AI can generate visual responses on the fly, in seconds, in response to whatever a user asks. But speed without review is a governance liability. The question isn’t whether AI can create content; it’s how you make sure the right content reaches your users. That includes dashboards, not just answers. A visualization is not the hard part; a trustworthy visualization is.
Tableau’s answer comes down to four things:
- A controlled path to production. Semantic modeling, agent optimization, and curated content creation all happen first in a controlled environment (a sandbox) where they can be reviewed, refined, and approved before being promoted to production. It mirrors the discipline software teams already trust: dev → staging → prod, now applied to analytics artifacts.
- Q&A Calibration. Data professionals and business experts curate the canonical answers to the most common and important questions, test agent responses against them, and officially verify the results. This ensures the agent draws on approved responses directly.
- Governed Slackbot skills. We built a small set of governed skills (rather than one do-everything agent), each with a single job: a Sales Leader Intelligence Brief, a Sales Data Q&A skill, and a skill that renders a dashboard directly in Slack, so a leader gets the at-a-glance, whole-business view without leaving the flow of work. The governed semantic layer powering the visualization makes all the difference. Rendering a chart in a chat tool is easy; ensuring that chart is built on verified, enterprise-wide logic is what creates real trust.
- A real review process, not an honor system. Skills get proposed, reviewed, and published against a standing internal governance process. The same discipline applied to a new dashboard is applied to a new skill.
When we built our first internal executive intelligence brief, the initial tests revealed several real-world data gaps: currency conversions dropped foreign accounts, mismatched field names led to inaccurate totals, and automated schedules failed quietly. Across broader internal tests, AI-generated dashboards surfaced similar issues: inconsistent layouts, broken links, and metric discrepancies.
In every case, the solution was clear: stop allowing AI skills to guess data structures from scratch, and ground them directly in a single, governed semantic layer with proper business preferences. Once that foundation was established, deployment accelerated dramatically. With the right governance for content and workflows, speed stops being a liability and becomes an advantage.
Today, creating a customized, fully governed dashboard skill for a new sales leader takes only a few minutes, resulting in dozens of trusted, purpose-built skills across Salesforce. This is what “made with Tableau” looks like in practice: converting ad-hoc requests or rough reports into secure, enterprise-grade dashboards without manual engineering effort.
3. Predictable total cost of ownership: “How do we control costs as usage scales?”
This is the question that keeps CIOs up at night, and rightly so. Every natural-language question can, in principle, spawn complex and expensive computes against your data warehouse. Multiply that by thousands of users asking whatever they want, and costs can spiral in ways that are hard to forecast.
The instinct many teams reach for first is having agents query the cloud lakehouse directly on every interaction. That’s exactly the pattern that gets expensive fast, and unpredictably so, because cost scales with usage in a way nobody sized for.
Tableau’s answer is to create the best experience for users and optimize for cost (compute at the edge):
- The semantic layer and Hyper engine do the compute before the model ever sees the data. Aggregation, semantics, and permissions are already resolved by the time a question reaches the LLM — no schema exploration, no retry loop. That alone is a major share of the token cost in an ungoverned setup.
- Extracts, not warehouse hits, on every call. Instead of an agent querying the data warehouse directly for every question, it queries a fast, governed Hyper extract (data at edge). This is the same pattern that lets one large customer move off direct-warehouse queries entirely and see costs drop by more than an order of magnitude, simply by putting a Tableau-managed extract in front of their agents instead of hitting the warehouse raw each time.
- MCP returns answers, not raw records. Because the model receives a pre-aggregated result instead of a dump of raw rows it has to interpret itself, both the token bill and the hallucination risk drop together; they’re two symptoms of the same underlying problem.
- Predictable, per-user pricing on top of that architecture. Flat, per-user pricing rather than billing per token or per query execution gives enterprise leaders budget predictability. This allows them to roll out agentic analytics across thousands of users without fearing runaway consumption bills.
- Response acceleration for the most common questions. Verified questions and caching reduce AI work at query time. A verified question match returns the approved answer instantly — no AI call, no warehouse hit. Caching serves repeat questions from a stored result, consuming zero tokens.
- Usage controls and scheduling discipline. We staggered our automated briefs across an overnight window instead of firing thousands simultaneously: a small design choice with a large effect on load and cost.
Speed and cost efficiency are two sides of the same coin. Well-curated context means agents process answers faster, and a faster answer is usually a cheaper one. Good structure isn’t just an accuracy investment; it’s a TCO investment. And the architecture that shrinks token volume matters as much as the pricing model that fixes the rate.eaper one. Good structure isn’t just an accuracy investment; it’s a TCO investment.
4. Agentic analytics monitoring: “How do we know what the AI is actually doing?”
Many organizations are deploying agents and then flying blind, with no visibility into what’s being asked, what’s being generated, or whether the system is getting better or worse over time. You can’t govern what you can’t see.
Tableau’s answer is operational transparency, from the level of a single answer all the way up to the whole deployment:
- Explainability in every answer. We built explainability into every answer, revealed through progressive disclosure. Each answer has a plain-language summary for the business user, drops one level to the fields used and filters applied for the data-curious, and goes all the way to the full SQL for data professionals.
- Thinking steps as the answer forms. The agent streams its thinking steps as it works, showing the plan it’s following. Users watch the reasoning take shape and trust the result because they saw how it was reached.
Most platforms can tell you that the AI answered. Tableau tells you how well and on what basis. That’s the difference between a black box and a system you can operate, trust, and improve.en a black box and a system you can operate, trust, and improve.
The bigger picture: Why the semantic layer is the unlock
Step back from the four questions and one theme connects all of them: the semantic layer.
The bottleneck in analytics isn’t access to data, it’s structure and business logic. The right answer is already in your Tableau semantic model (Published Data Source). Today, 97% of Fortune 500 have encoded their business logic in Tableau. They use Tableau dashboards every day to make multi-million dollar business decisions, because they trust the business logic in their Tableau semantic models.
Here’s Tableau’s advantage, and it’s the through-line of the whole Customer Zero story: we didn’t have to build that layer from scratch, and it isn’t tied to one product. Tableau has invested in the semantic layer for years, and it shows up the same way whether you’re on Tableau Next or Tableau Cloud and Server — published data sources, workbooks, and metrics map to the semantic structures. As Customer Zero, we connected Slackbot Skills to whichever governed layer already existed (Tableau Next, Cloud, or Server) and inherited the governed definitions, the row-level security, and the trusted business logic on day one.
The semantic layer collapses ambiguity. Business preferences surface the domain knowledge that lives in analysts’ heads. Together, they produce an agent that reasons from governed truth instead of hallucinated inference. That’s not a feature. That’s the foundation everything else stands on.
Your path to trusted agentic analytics at scale
If you’re a CDO or CIO thinking about deploying agentic analytics, the four questions above aren’t details to sort out later. They are the architecture: semantic governance, content governance, predictable cost, and operational monitoring. Get them right and the agent becomes something your organization trusts. Get them wrong and you’ve built a very fast way to be confidently incorrect — and with runaway costs.
Tableau answers all four because we didn’t design them in a conference room. We lived them as Customer Zero, deploying to tens of thousands of our own employees through Slackbot Skills powered by Tableau, across Tableau Next, Cloud, and Server. And we built the product to reflect what we learned.
The technology to put a capable analyst in every employee’s pocket finally exists. Whether it earns their trust comes down to the structure underneath. That’s the part we’ve spent years building, and the part we’d love to help you build too.
Ready to get started?
- Watch the on-demand webinar How We Run Sales with Slackbot + Tableau.
- Learn how to set up an intelligence brief with Tableau Next and Slackbot skills.
- Explore Tableau Semantics and Tableau Knowledge.
- Contact us to explore conversational analytics for your teams, powered by Tableau.
Read the full Customer Zero story
Learn how Tableau Next and Slackbot helped Salesforce empower an agile sales team with conversational agentic analytics.