An Architect’s Guide to Event Monitoring


See how event monitoring works under the hood in Salesforce, and how it maps to the Salesforce Well-Architected Framework.

As Salesforce Architects, we’ve all encountered the challenge of ensuring that our solutions are not just functional, but also fundamentally robust. Most of us have been in crisis meetings about slow running processes, strange Apex errors in production, or data that may have been accessed without permission. The key to a great implementation is not having zero issues — but having the ability to triage those issues quickly with data to back up decisions.
This is where Salesforce Event Monitoring comes in. It provides the critical data needed to audit performance, track security, and understand user behavior, allowing you to proactively build a solution that aligns with the Salesforce Well-Architected Framework.
Event Monitoring provides insights into user and system activity. It’s the answer to some of the most critical questions an architect needs to ask, such as:
- How do you know who has viewed a record?
- How can you see how long a report took to run?
- How do you block a user from exporting a large number of records from a sensitive report?
- How do you alert someone when “View All” and “Modify All” permissions are changed?
Building on a strong monitoring foundation
Salesforce provides a robust set of services to monitor system and user activity as part of its standard editions. These tools form a critical foundation for any architect’s monitoring strategy, providing essential visibility into administrative changes, user access, and system health.
A sample of these methods, their primary function, and some considerations are listed below.
| Method | Primary Function | Key Considerations |
| Trust Website | Provides a view of planned maintenance, incidents, and outages. | Manual subscribe for notifications. API available. |
| Setup Audit Trail | Tracks administrative configuration changes. | Retains six months of history. |
| Login History | Analyzes user login attempts and patterns. | Retains six months of history. |
| Field History Tracking | Audits data changes at the record level. | Standard retention is limited; requires paid add-on for long-term storage. |
| Security Health Check | Assesses security settings against a baseline. | Provides a security score but does not fix the issues; requires manual action. |
| Storage Usage | Provides a view of file and data storage by Objects. | Data and file storage are calculated asynchronously and your usage isn’t updated immediately. |
| Limits API | Lists information about governor limits in your org. | Requires a third-party tool to programmatically access and store output to track usage over time. |
| Salesforce Optimizer | Scans for technical debt and inefficiencies. | Being retired in Winter ’26. Users must transition to alternative tools. |
| Debug Logs | Deep-dive analysis of Apex code and process failures. | Extremely short retention (24 hours for system logs), size limitations. |
| Scale Center | Designed for proactive assessment and resolution of scale issues. | Available for Unlimited Edition orgs. Customers in the EU Operating Zone are not able to access Scale Center. 30 days of data available. |
| Event Monitoring (Free-Tier) | Tracks key activity for limited Event Log Files. | Enterprise, Unlimited, and Performance Edition orgs have free access to seven Event Log Files with one-day data retention. A paid add-on is required for the broader capabilities described in this blog post. |
Monitoring services available in standard Salesforce editions
.While these services provide a strong starting point, they don’t always offer a complete picture. A paid add-on subscription for Event Monitoring allows you to go beyond these foundational services to enhance your monitoring capabilities.
What is Salesforce Event Monitoring?
Event Monitoring provides transparency into user behavior and system performance. It collects and stores user activity — referred to as “events” — in log files and objects, which can then be used for analysis. Event Monitoring is a core component of the Salesforce Shield product offering, a suite of services designed to help companies build an extra layer of security, compliance, and control. In addition to Event Monitoring, Salesforce Shield includes Platform Encryption, Data Detect, and Field Audit Trail, forming a comprehensive solution for protecting sensitive data and meeting regulatory requirements.
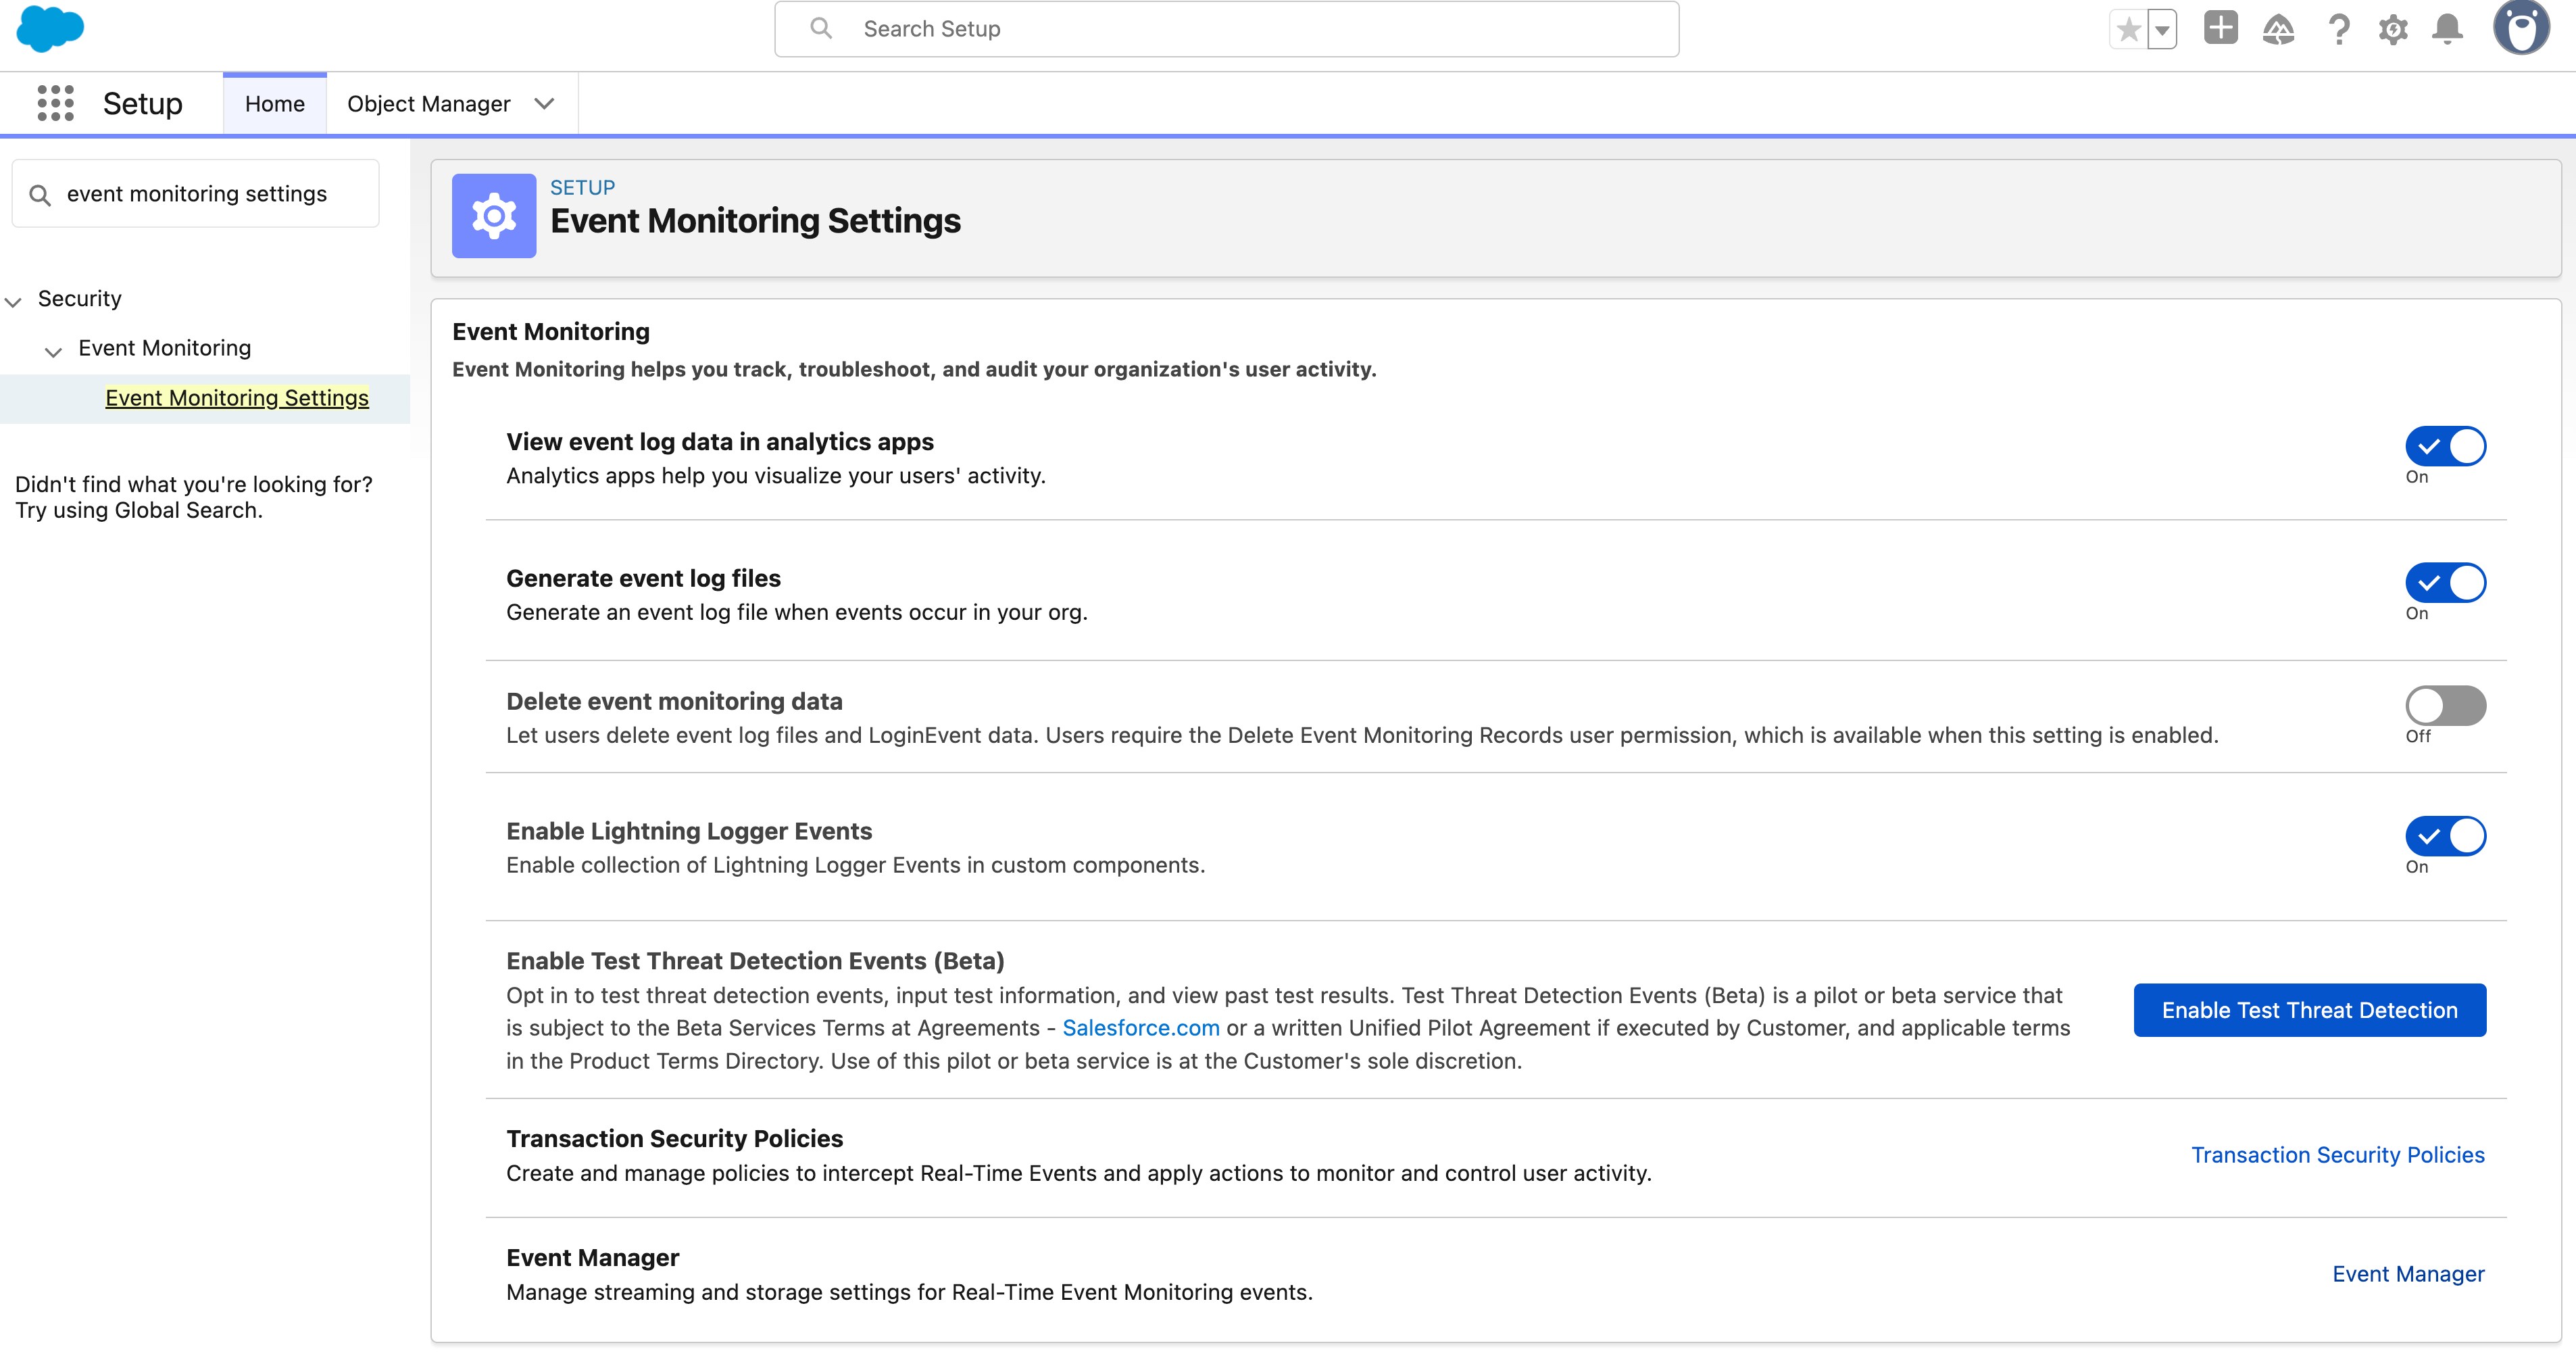
To access the full range of Event Monitoring capabilities, an organization must have a Salesforce Shield or Event Monitoring add-on subscription. Once enabled, you can access key settings from Setup under Event Monitoring Settings.
While Event Monitoring is one product, it offers a number of capabilities that can be hard to navigate within a holistic picture. Let’s look at the underlying key components in an easy-to-understand diagram.
How it works
Please note that the following diagrams are up to date as of the Winter ’26 release. The number of events listed in each diagram is meant to be a point-in-time guide that highlights key differences in events available for each capability of Event Monitoring. For brevity, Enhanced Mobile Application Security events have been omitted. Always refer to the documentation and release notes for the most up-to-date information.
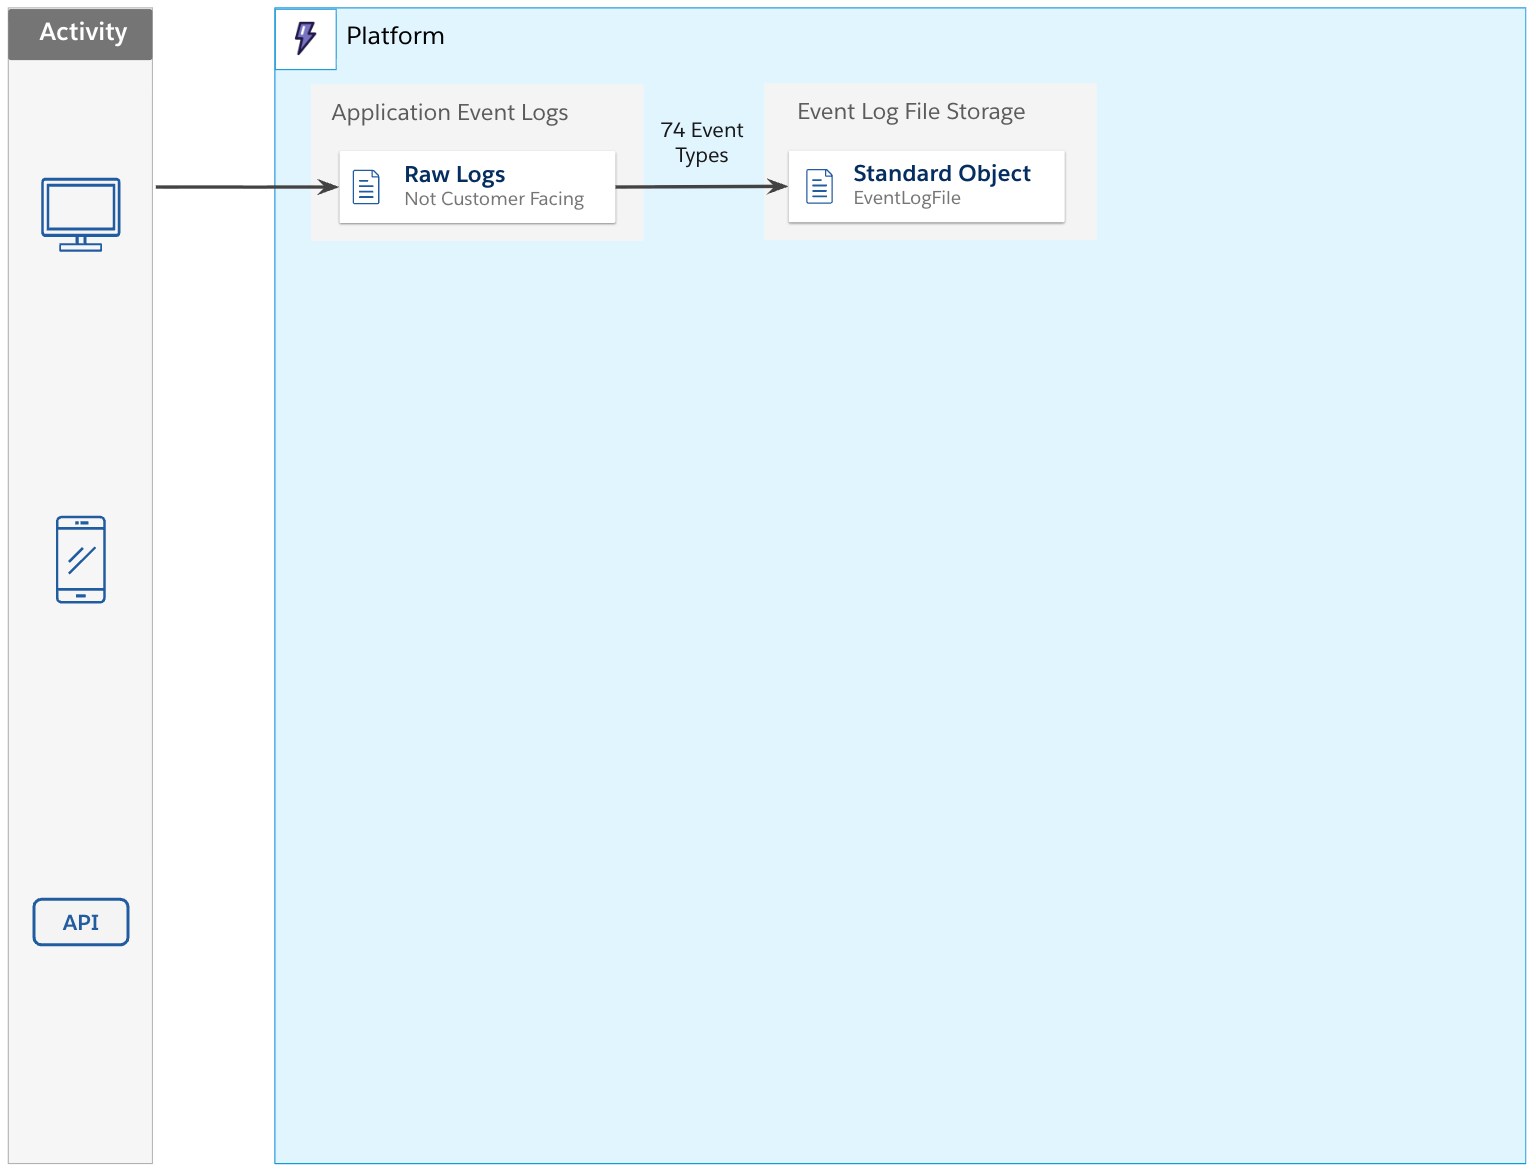
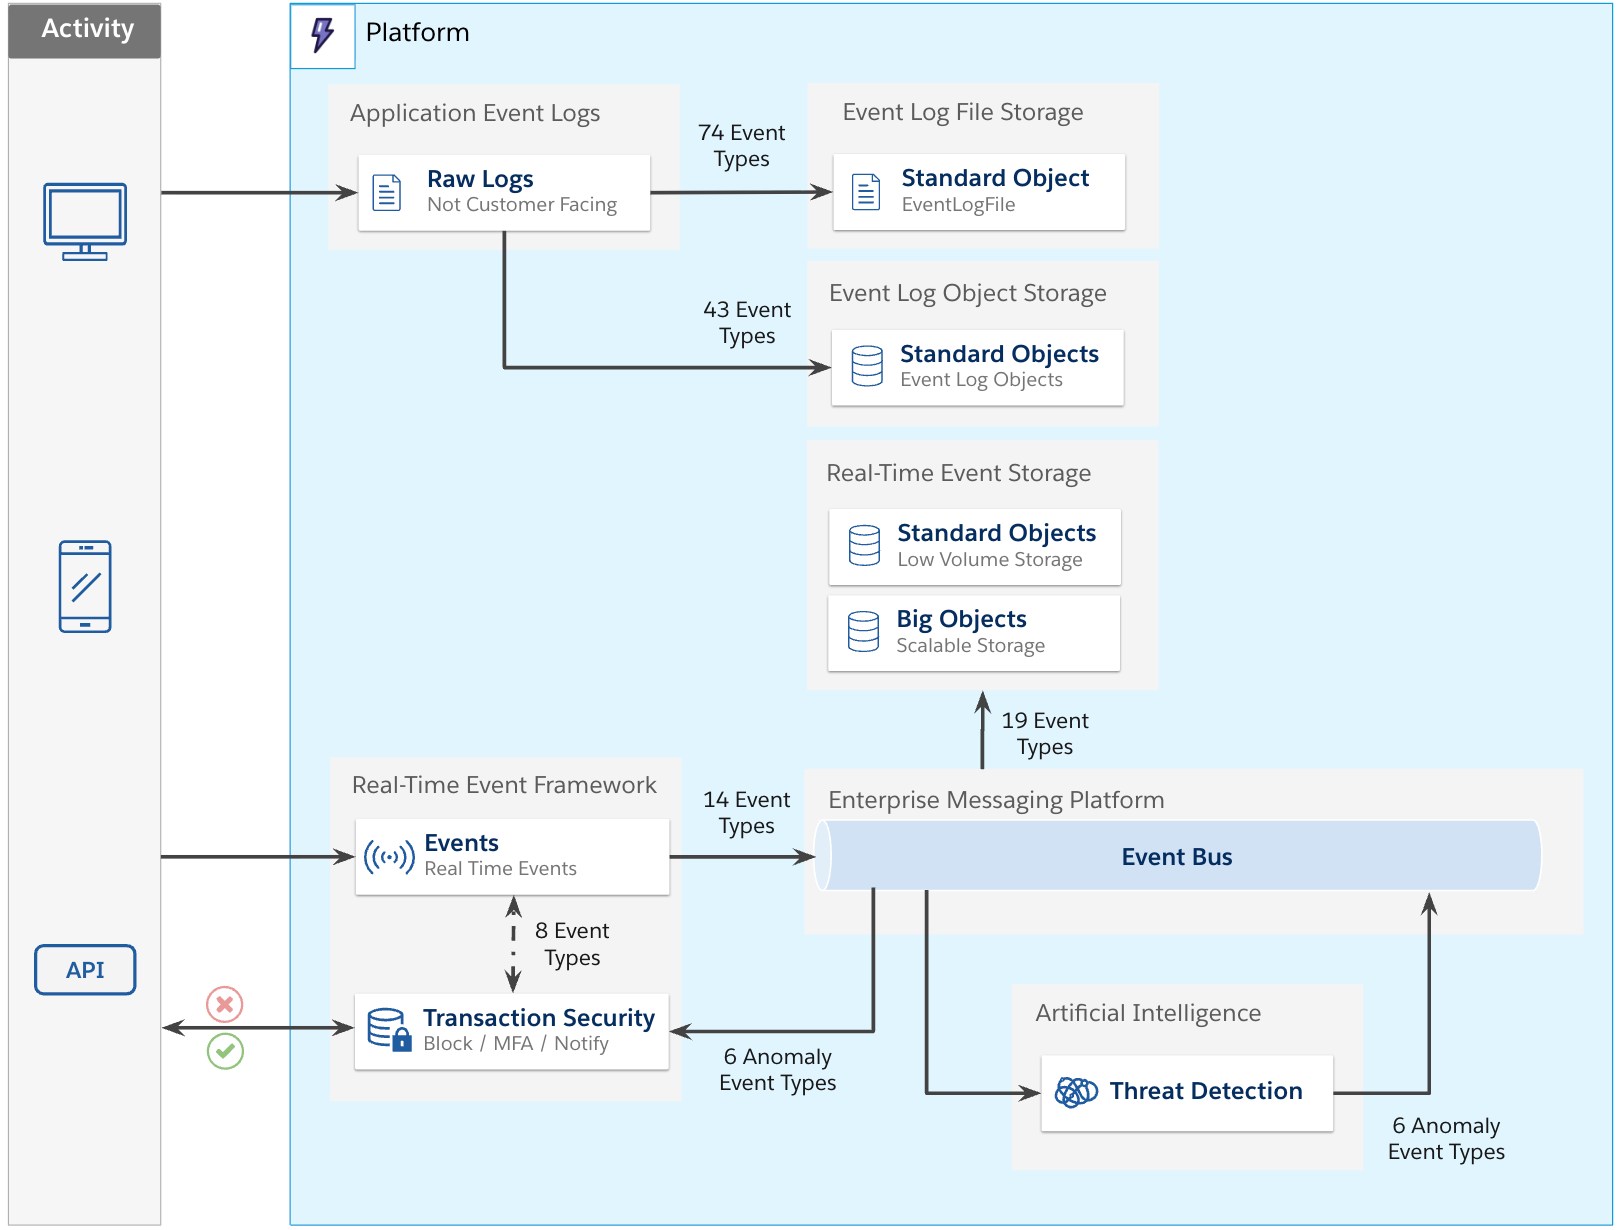
The Event Log File framework
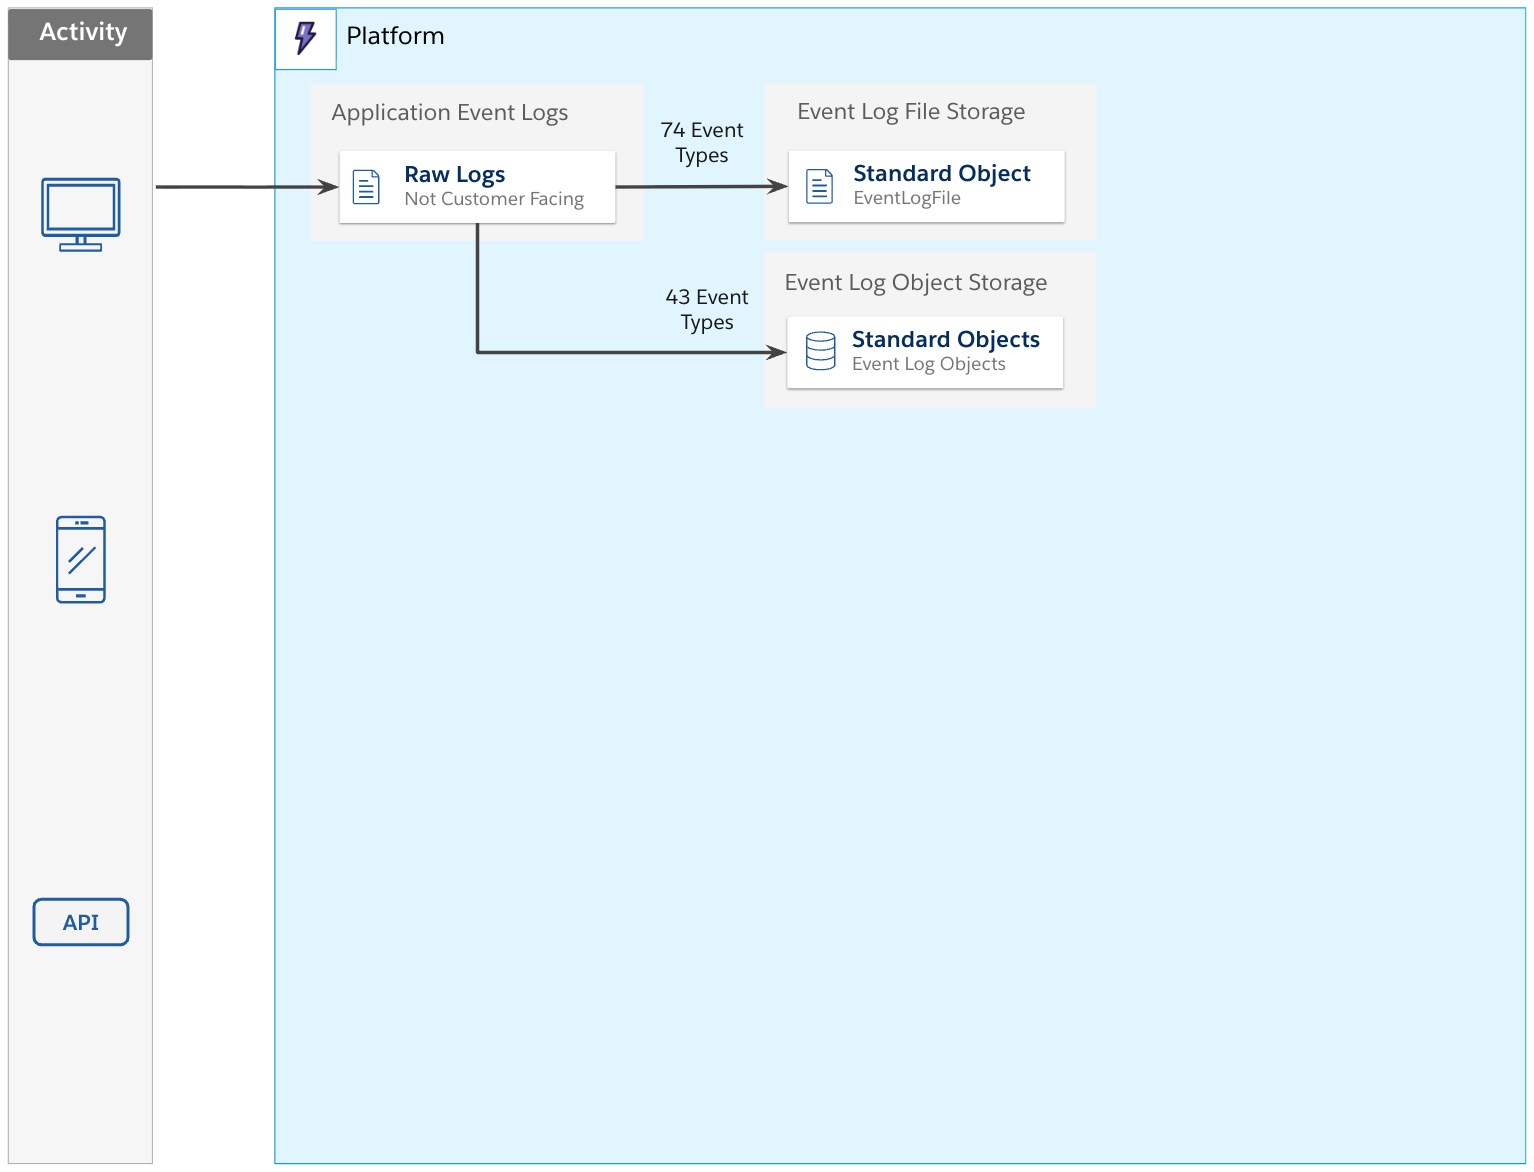
Application events captured by Salesforce (from many types of interaction) are persisted. Given the nature of Salesforce’s multi-tenant environment, the logs themselves are not much use to customers and are not available in their raw format. To make these consumable for customers, a number of events are copied for each org.
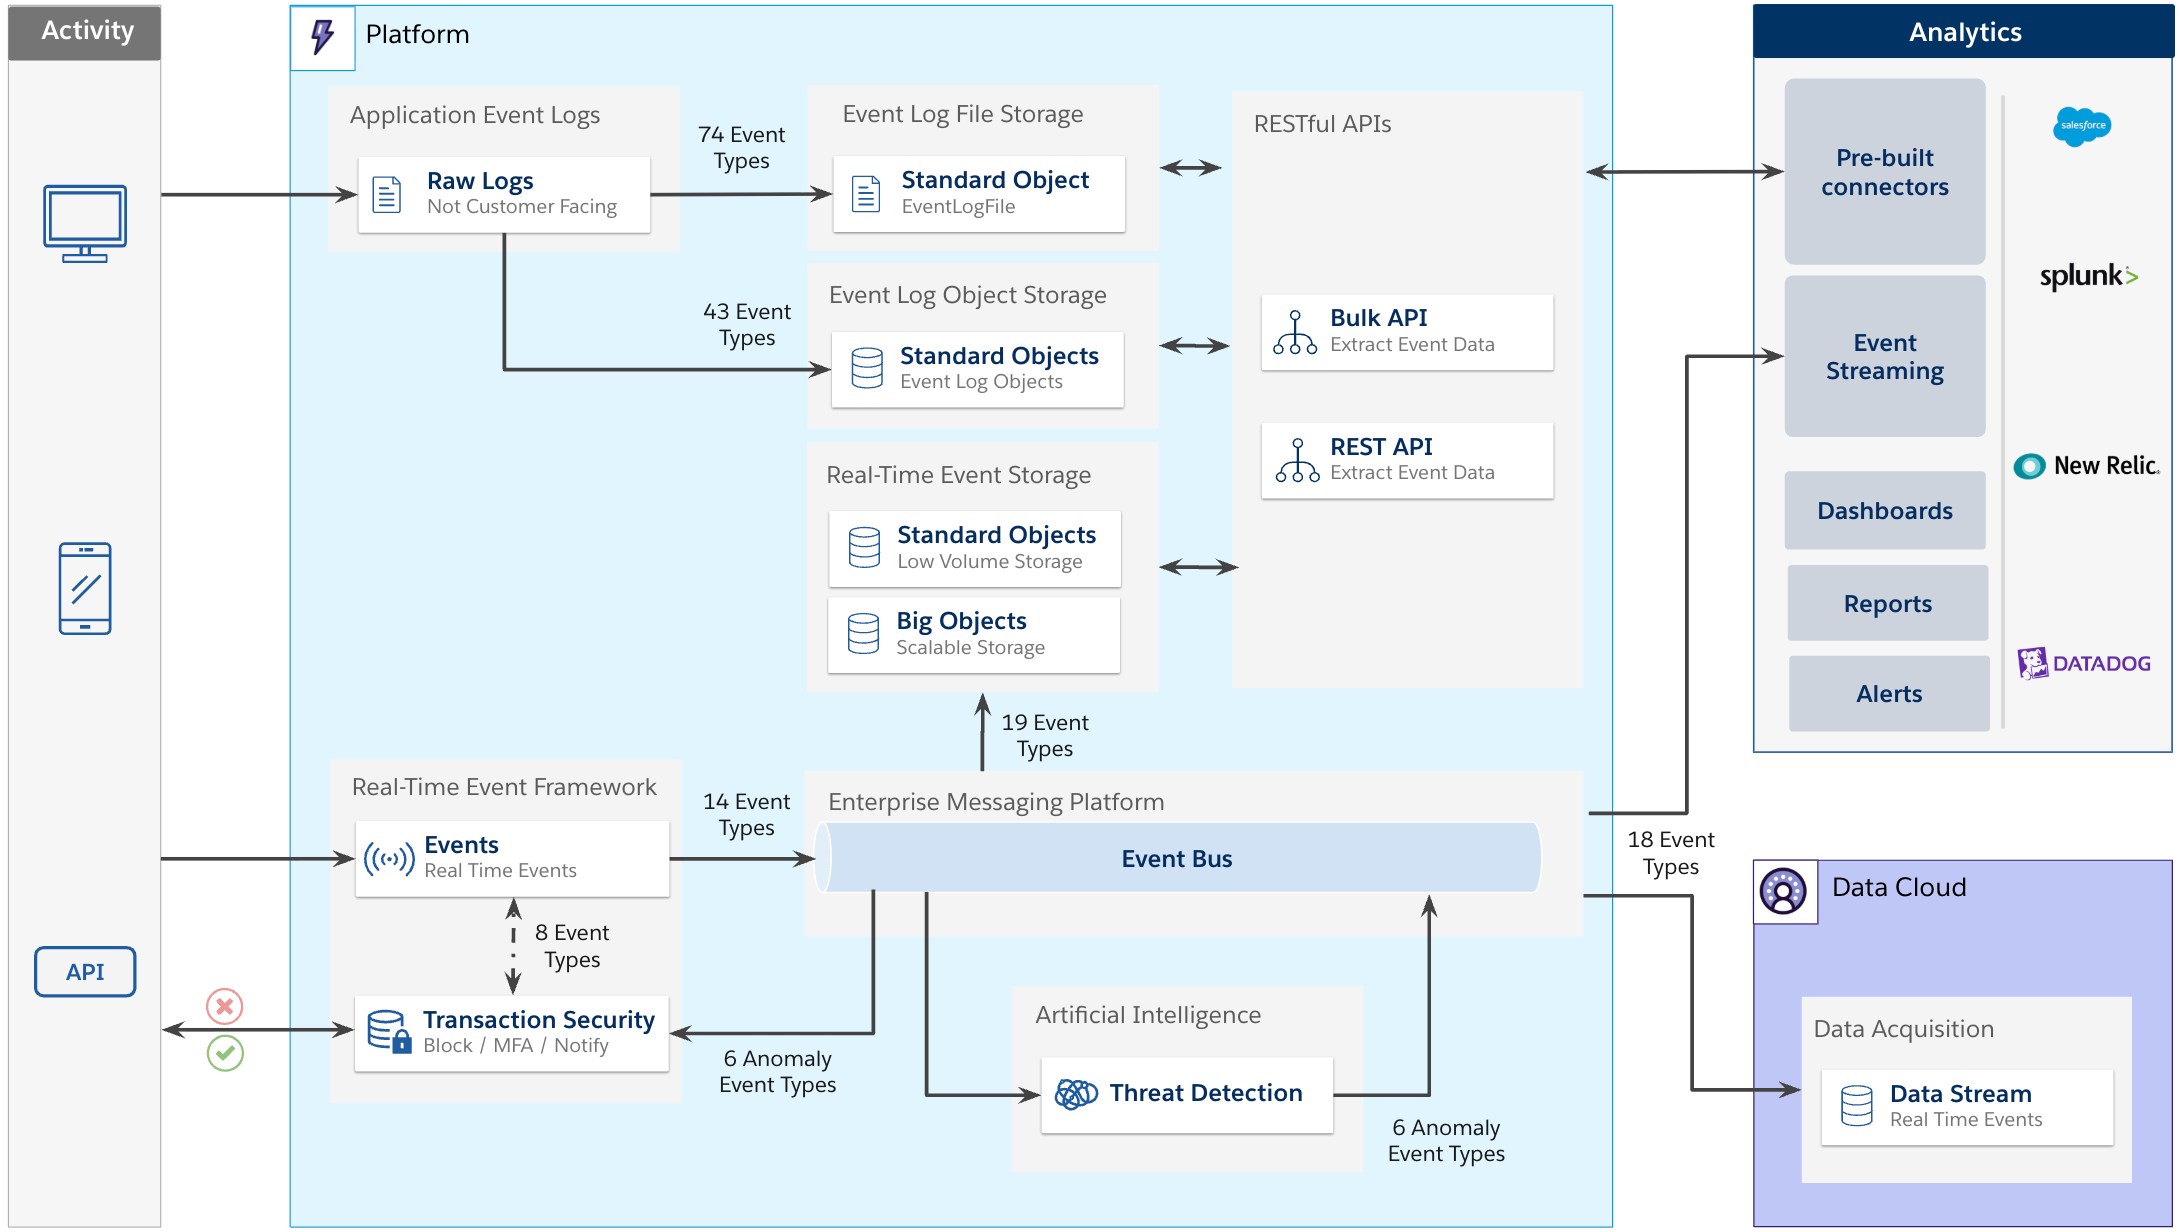
Seventy-four event types are made available to event monitoring customers by making a copy of those transactions, specific to their org, into a standard object called EventLogFile and supporting file storage. This process is asynchronous in nature and operates in batch mode, copying transactions hourly and daily,so current events can take up to one hour to be available.Given the vast volumes of application logs captured, Salesforce stores up to one year’s worth of activity, or one day if using a Developer Edition org.
Make sure you opt in for Event Log File generation if you need log files generated and delivered to your org for Developer and Trial orgs.
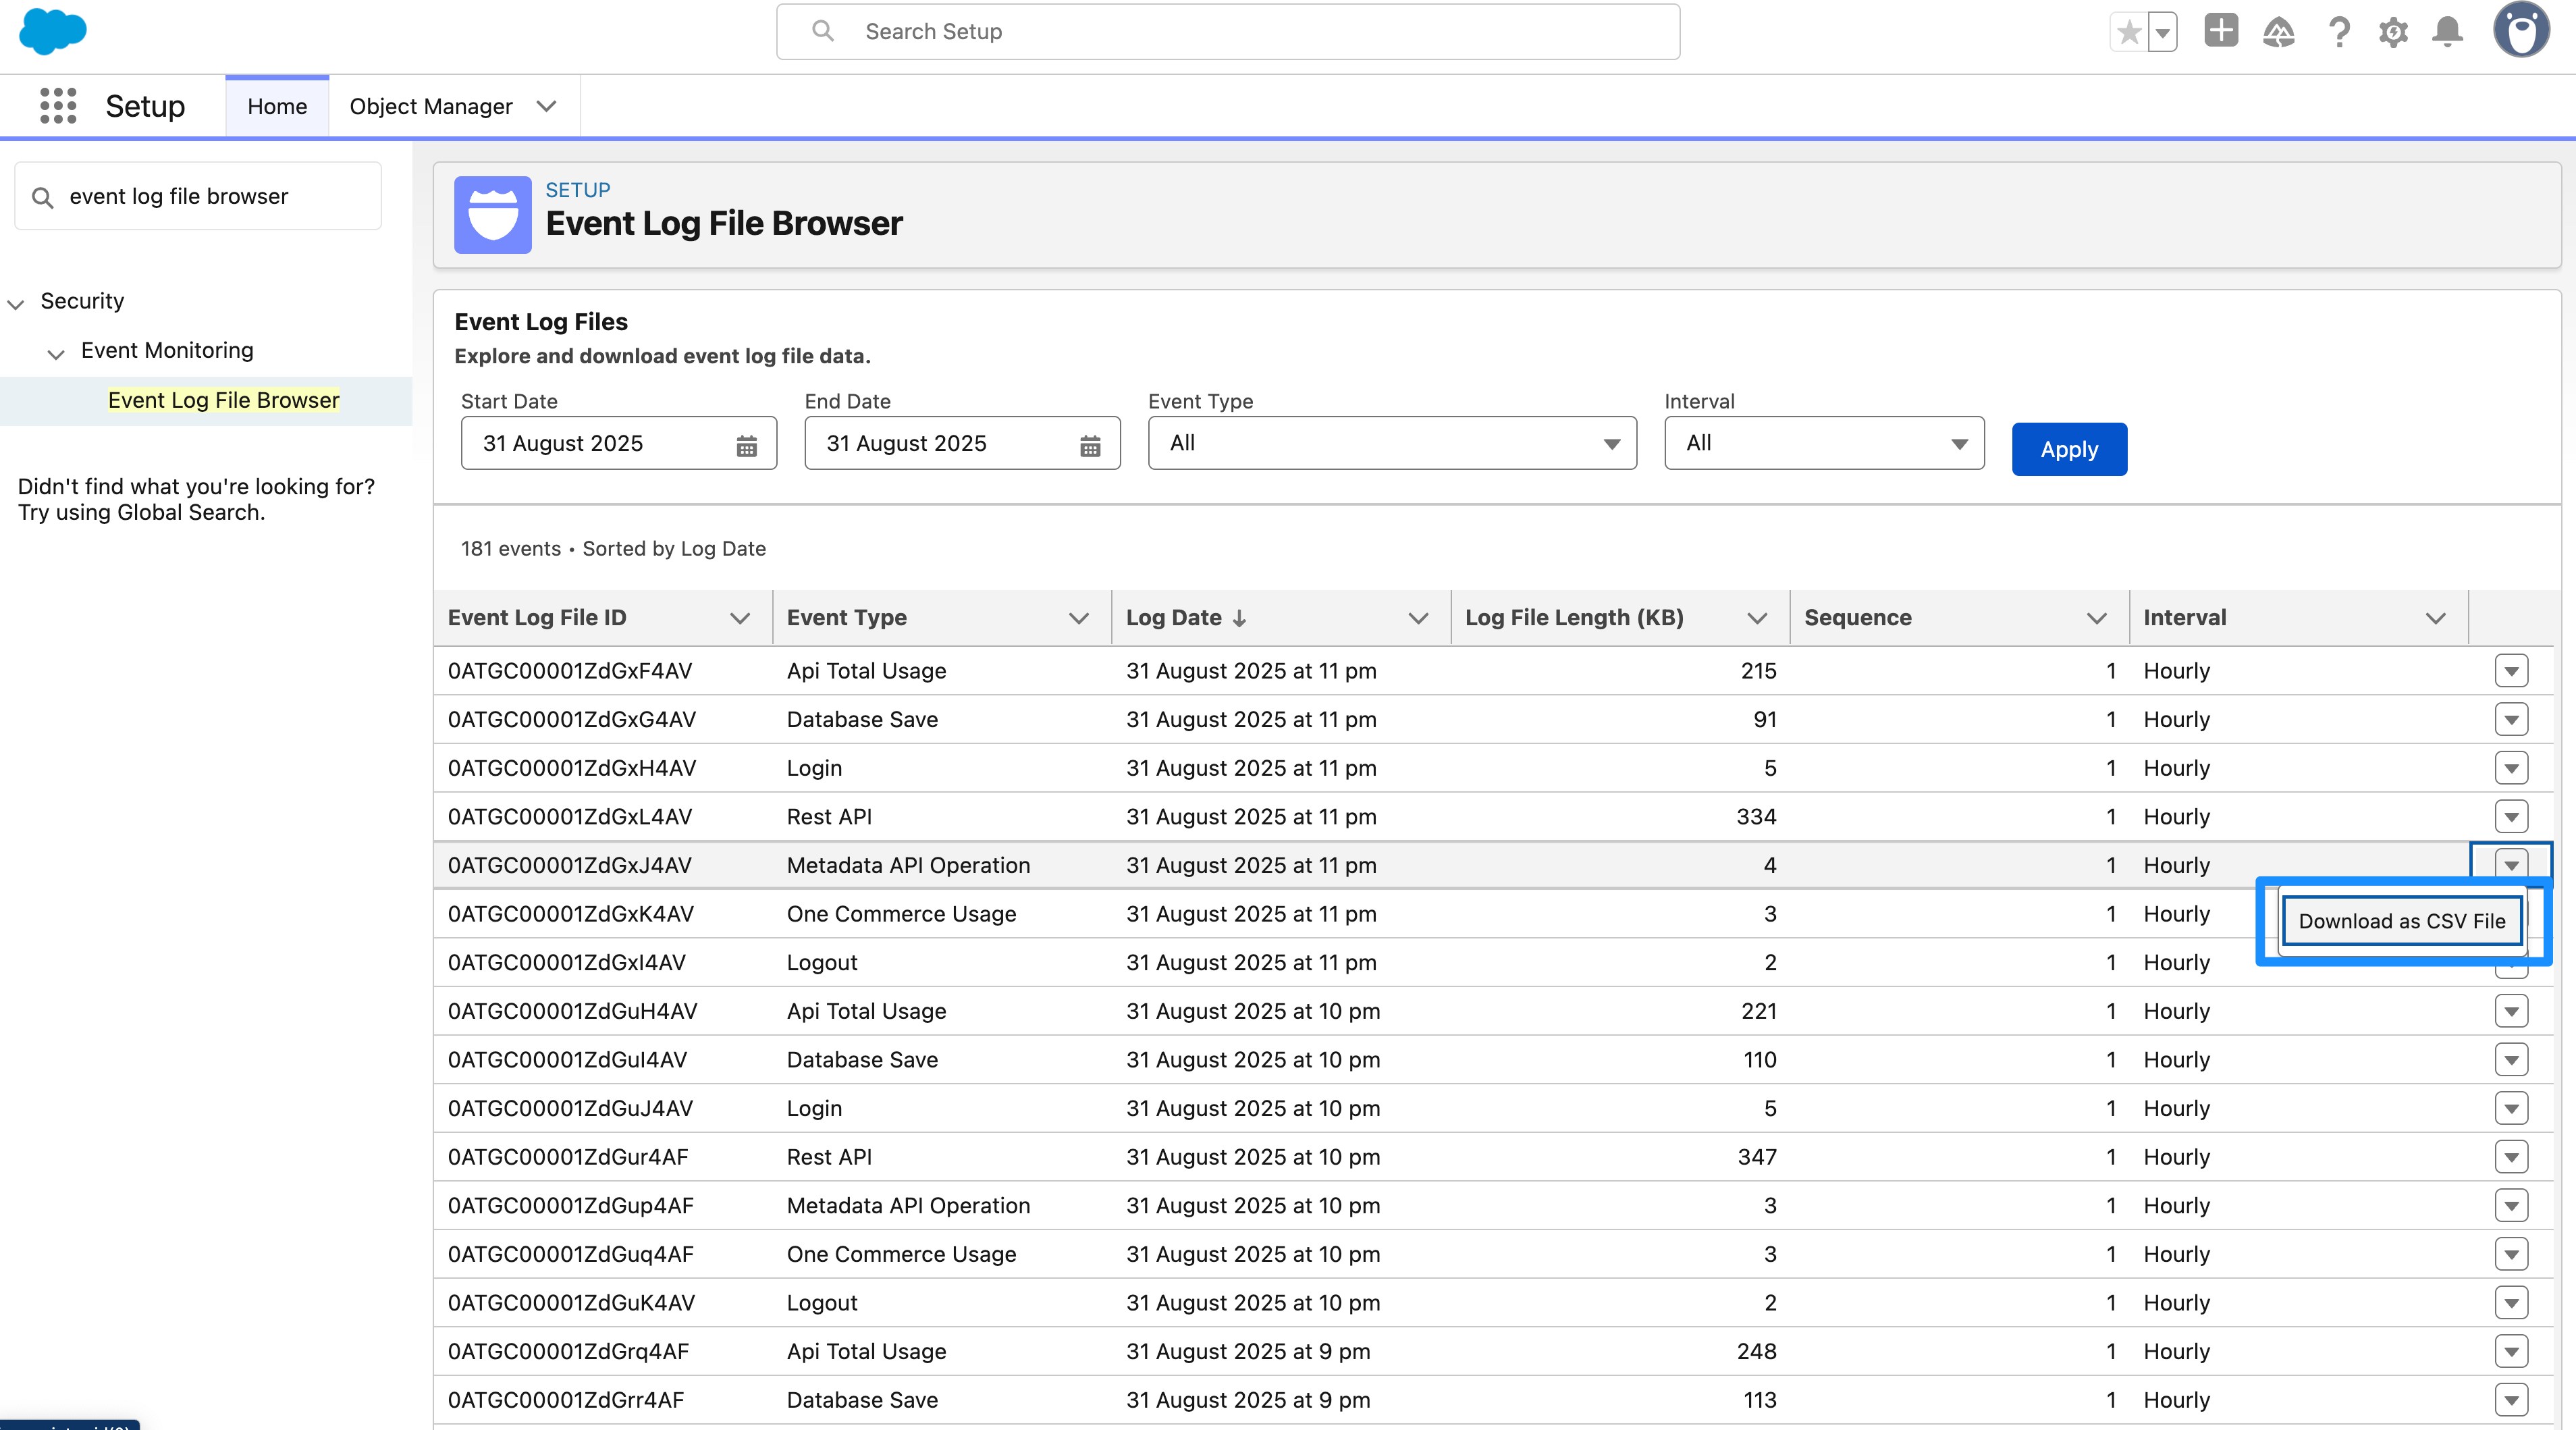
You can explore and download your Event Log File data using the Platform REST API or use the Event Log File Browser, which makes each log file available in the Setup menu.
The Event Log Object framework
The Event Log Object framework surfaces event data stored in a standard object, referred to as Event Log Objects. They store critical event data that you can query via Salesforce Platform APIs. Event log objects contain many but not all events represented in the Event Log File framework — currently supporting 43 events.
Unlike Event Log Files, which surface event data as CSV files, Event Log Objects allow querying of event data in a series of standard objects. This provides some benefits, enabling easier, faster analysis.
- Storage uses standard Salesforce objects for simplified SOQL and API support
- Data available to query within 25-45 minutes after the event is logged
- Managed security with the View Event Log Object Data permission
- Log data retained for 30 days, with up to 15 days of data supported at a time via query
The Real-Time Event Monitoring framework
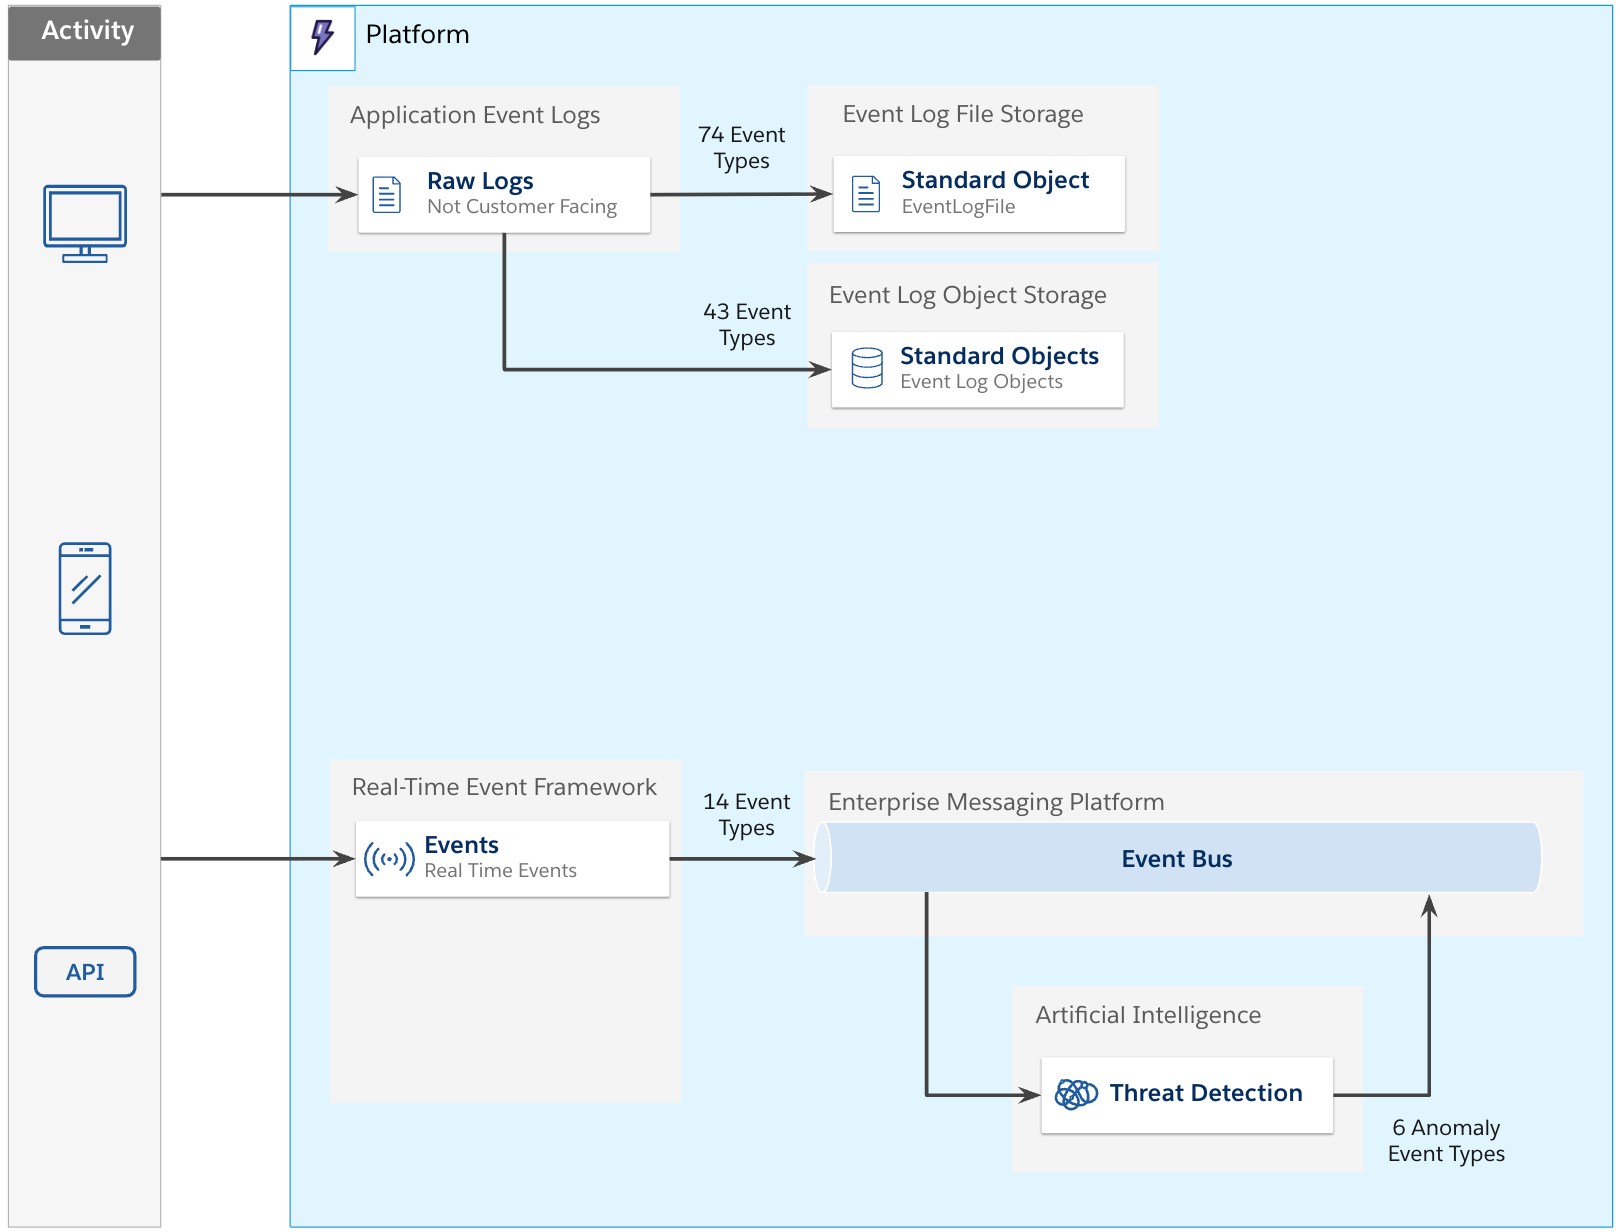
The Event Log File and Event Log Object frameworks don’t support real-time events. The Real-Time Event Monitoring framework addresses this issue by streaming events. It contains events specifically designed for streaming — currently supporting 20 events (14 events from user activity and six events from anomaly detection, covered later in this post). These events are published to the Enterprise Messaging Platform, backed by Apache Kafka and other services. This infrastructure is managed by Salesforce to provide a scalable, performant solution for triaging events in near-real time.
The Real-Time Event Monitoring framework has three key components: Threat Detection, Transaction Security, and Event Storage.
The Threat Detection component
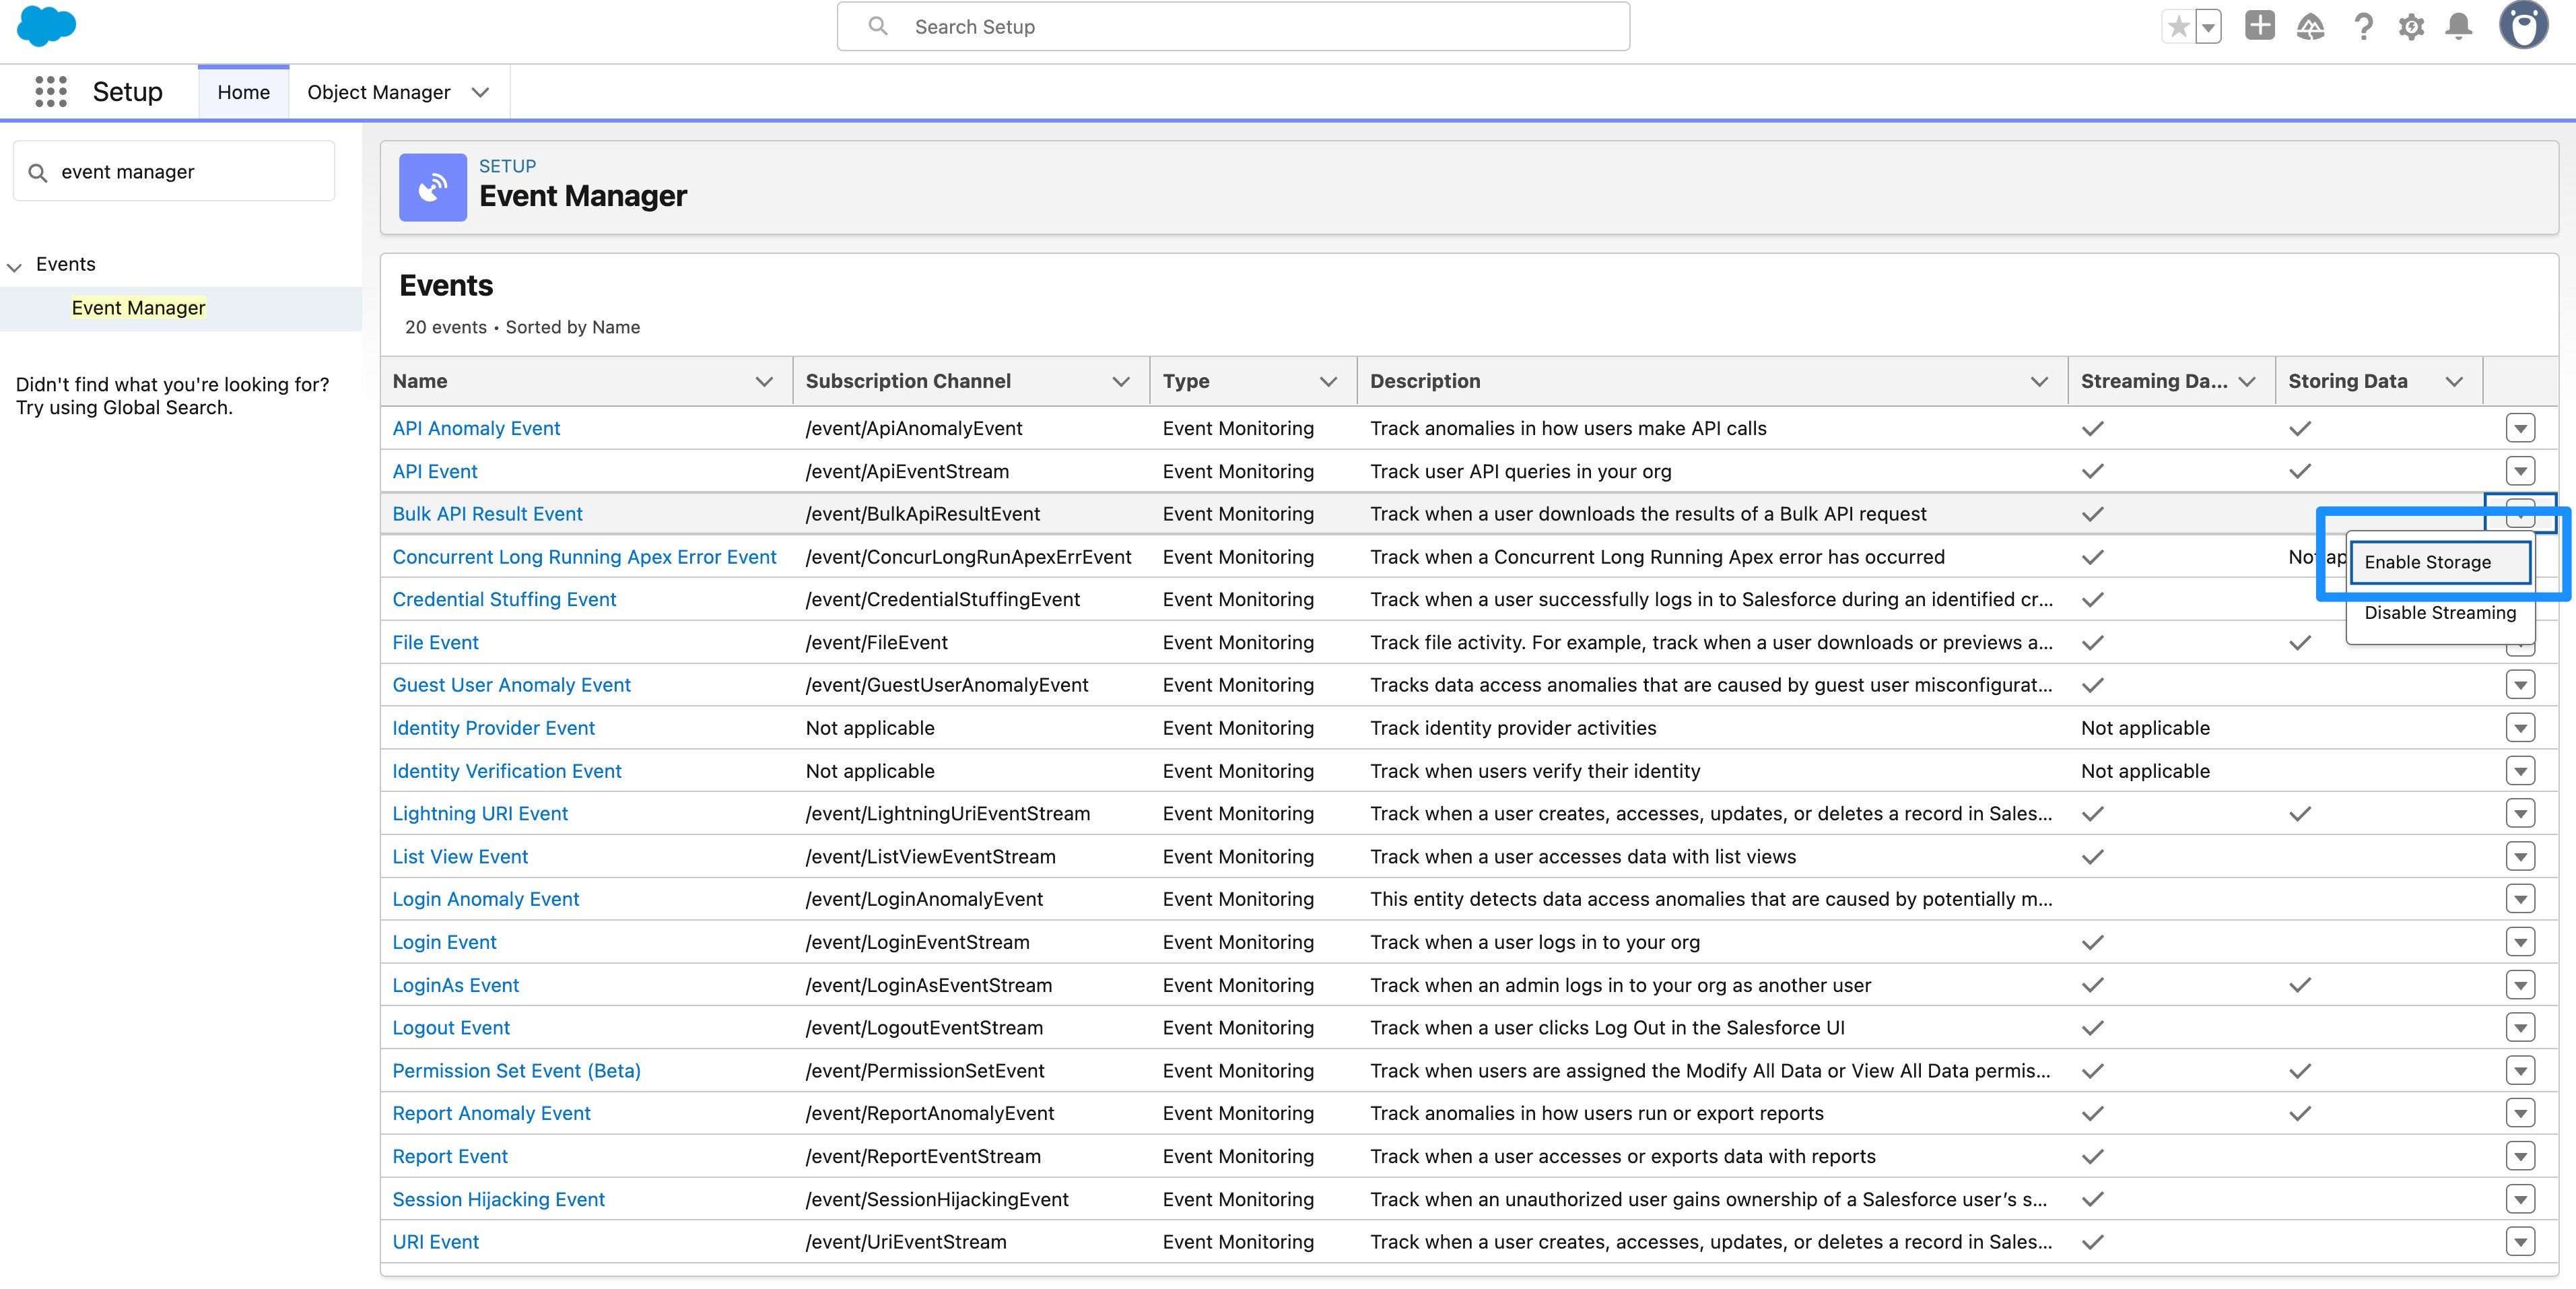
This streaming pattern allows for innovative solutions that can use threat detection to look for suspicious events. This service uses machine learning and reads user patterns to detect anomalies, which adds an additional six events that can be streamed.
In the screenshot above, six anomalies are identified: credential stuffing, session hijacking, login anomalies, API anomalies, guest user anomalies, and report anomalies. Note that if you need to generate test events to simulate these threats to verify business logic that is listening for these types of events, you can use the new Generate Test Events for Threat Detection (Beta).
Credential stuffing events
Credential stuffing can be detected by researching stuffing traffic patterns and doing time-bucketing analysis of those patterns over time. When this type of anomaly is detected, the user will be presented with an identity challenge and be required to reset their password. The threat detection service also publishes a CredentialStuffingEvent (see docs) to the bus.
Credential Stuffing Event
| Description | Detection | Mitigation |
| – Brute force username and password combinations targeting same endpoint or enumerating multiple passwords | – Research stuffing traffic patterns – Time-bucketing analysis – Same endpoint fingerprints | – Identity challenge – Password reset required – Security event sent |
For more, general information on this type of cyberattack, check out the article How Salesforce Helps Protect You From Credential Stuffers.
Session hijacking events
By fingerprinting the TLS negotiation between client and server, Salesforce can detect potential malware installed on a user’s device. When this type of anomaly is detected, the user has their session terminated and multi-factor authentication is required. The threat detection service also publishes a SessionHijackingEvent (see docs) to the bus.
Session Hijacking Event
| Description | Detection | Mitigation |
| – Malware installed on user’s device – Virus manipulates browser pages and collects sensitive info | – Fingerprinting the TLS negotiation between client and server | – Session terminated – MFA required – Security event sent |
Salesforce has been at the forefront of this method of detection for some years and has documented an open-source method for fingerprinting TLS clients on the wire (see details in the article Open Sourcing JA3).
Report anomaly events
Report exports are potential opportunities for data loss. Transaction security policies provide one mechanism to detect and block this activity, but anomaly events takes it a step further. The threat detection service baselines behavior over time. Customers can then see threshold scores based on deviation from this normal behavior and generate anomalous events in real time that they can then investigate. A corresponding ReportAnomalyEvent (see docs) is published.
Report Anomaly Event
| Description | Detection | Mitigation |
| – Data loss through access and exporting data over time | – Model report generation activities over 90 days and baseline – Score created for report generation activity vs. baseline | – No automated remediation – Security event sent – Customer investigates |
For more detailed information on detecting anomalous events, check out the article How Salesforce Helps Protect You From Insider Threats and familiarize yourself with the training and inference steps.
Login anomaly events
An anomalous login refers to the detection of a potential attacker attempting to gain unauthorized access to a legitimate user’s account. This threat detection event identifies login attempts that deviate significantly from a user’s typical login behavior, such as unusual times of day, unfamiliar devices, or unexpected locations. A corresponding LoginAnomalyEvent (see docs) is published.
API anomaly events
Similar principles apply to the API anomaly event. An API anomaly is any user activity that is sufficiently different from the historical activity of the same user. A corresponding ApiAnomalyEvent (see docs) is published.
Guest user anomaly events
This anomaly event uses the metadata in Salesforce Core application logs to build profiles representing guest users’ data access activities. Guest users are unauthenticated users who can access public-facing digital experiences, such as a Salesforce Experience Cloud site. This threat detection event identifies suspicious attempts to access organization data. A corresponding GuestUserAnomalyEvent (see docs) is published.
The Transaction Security component
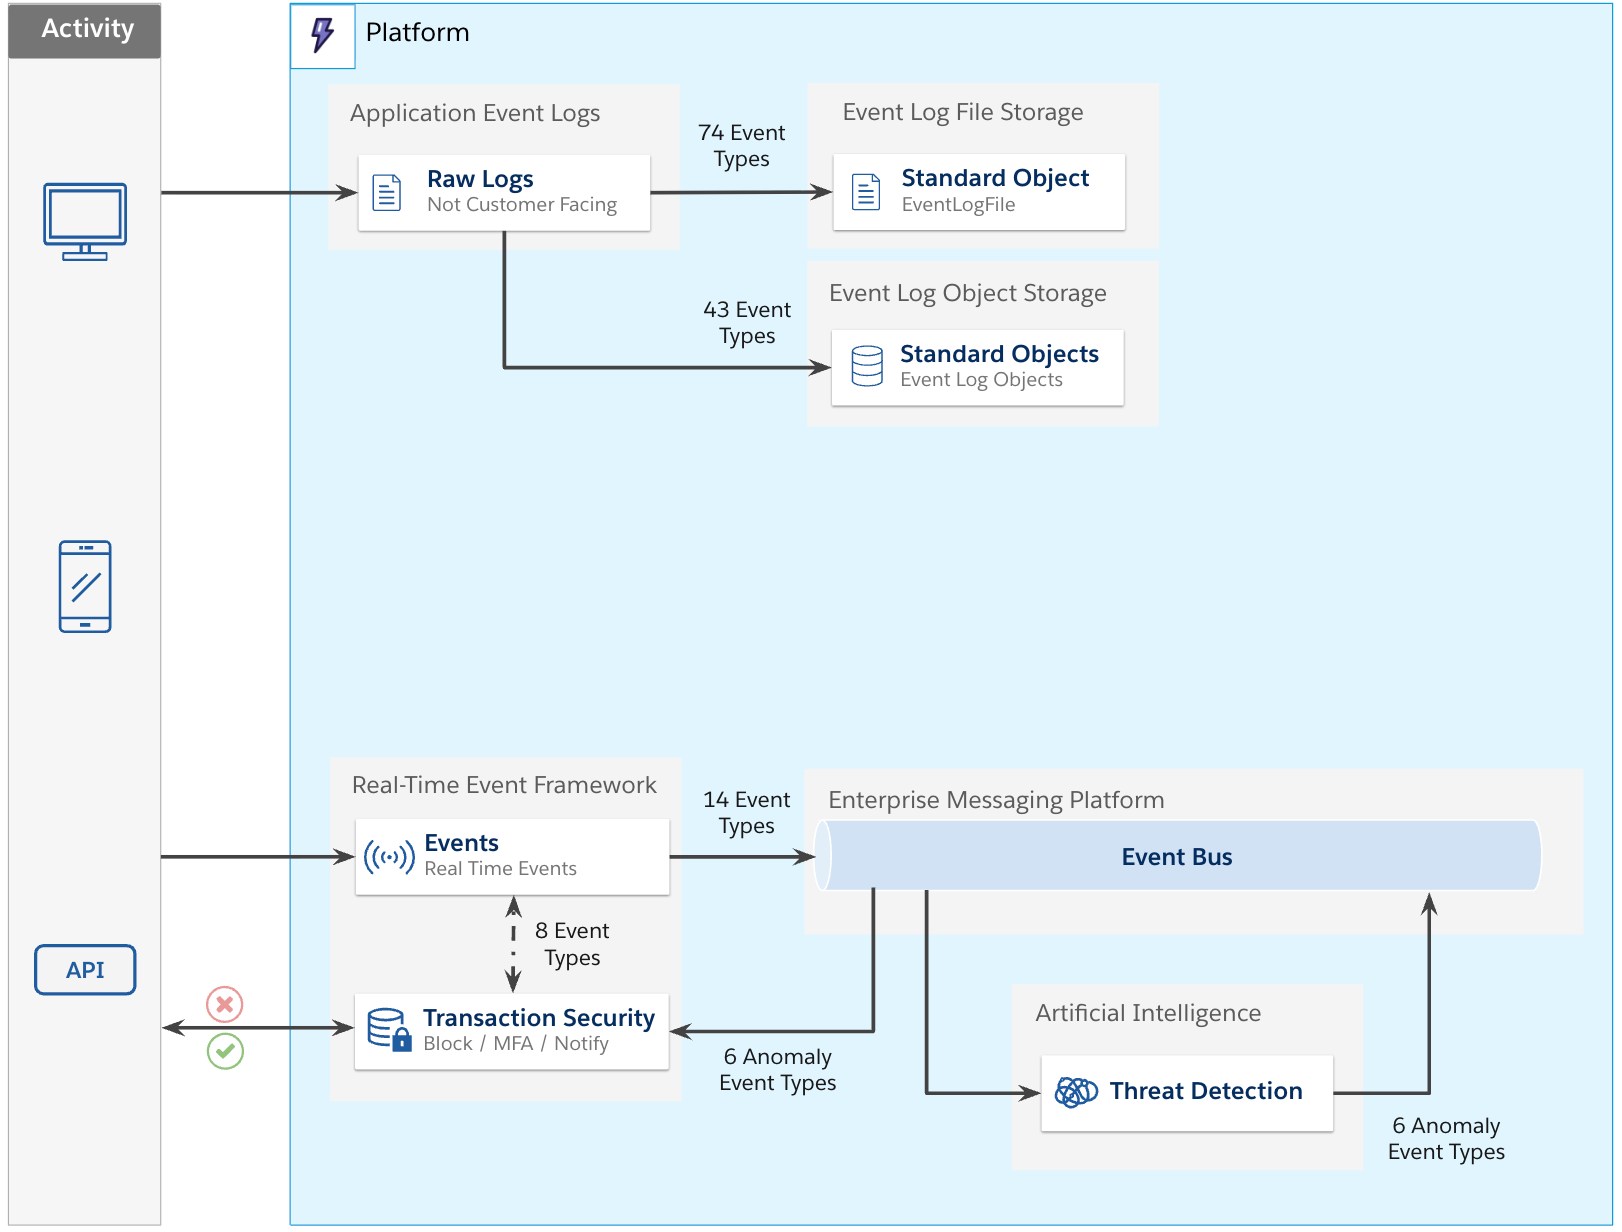
Fourteen event types are captured synchronously by Transaction Security (eight activity events with six threat detection events). Transaction Security allows customers to create security policies in Salesforce to address security risks. Given that these transactions are synchronous, it provides customers with the ability to take immediate action. The actions you take can be to block the transaction or to require two-factor authentication. You can also send an email or in-app notification to alert a person or team.
There are two ways to create a transaction security policy: with Condition Builder (declaratively), or with Apex.
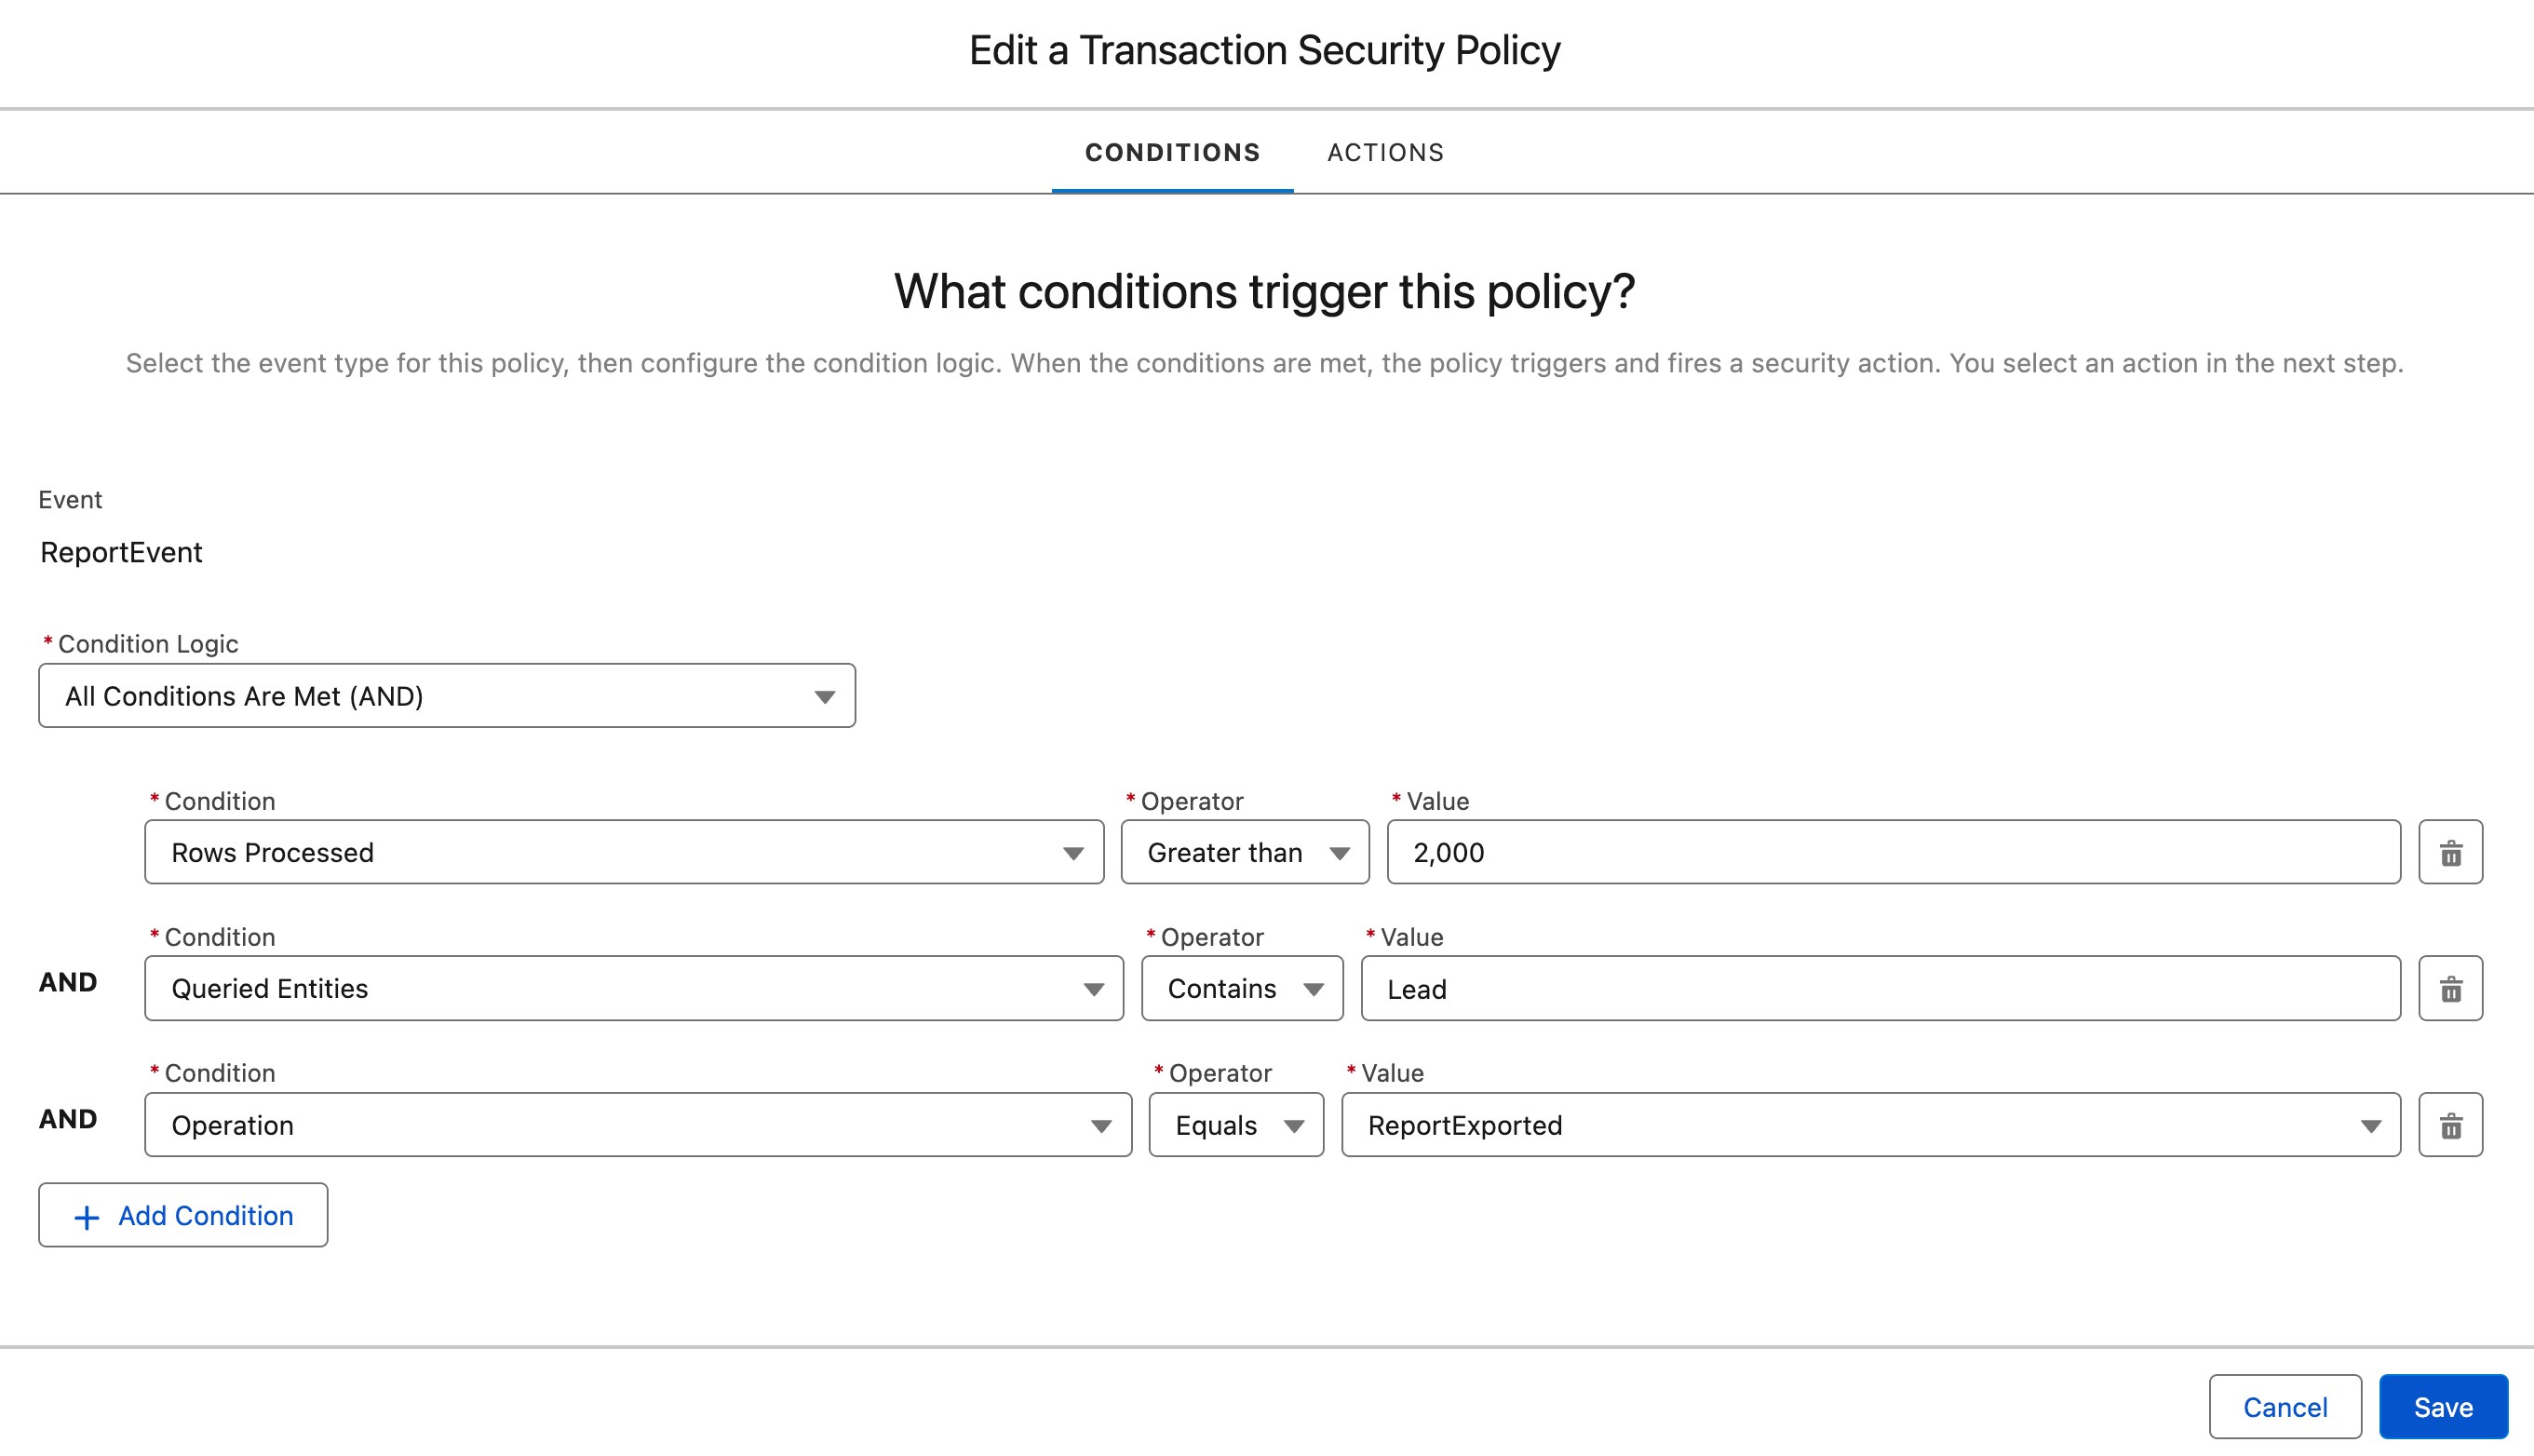
Condition Builder
This tool allows you to create a transaction security policy without writing a line of code. You set up simple condition logic with operators to create customized security policies to protect your data.
For example, we can use the Report Event to track when a user exports more than 2,000 rows from any report using the Lead object.
Apex
If you need more flexibility than simple conditions allow, then you can use Apex. To do so, create or select an existing class that implements the TxnSecurity.EventCondition interface.
For examples, check out the documentation.
Policy actions
Regardless of whether you choose Apex or Condition Builder, the policy can choose which action to take when the logic is triggered — Block or require multi-factor authentication. You can also specify who to notify and the notification method, e.g., via an email and/or an in-app notification.
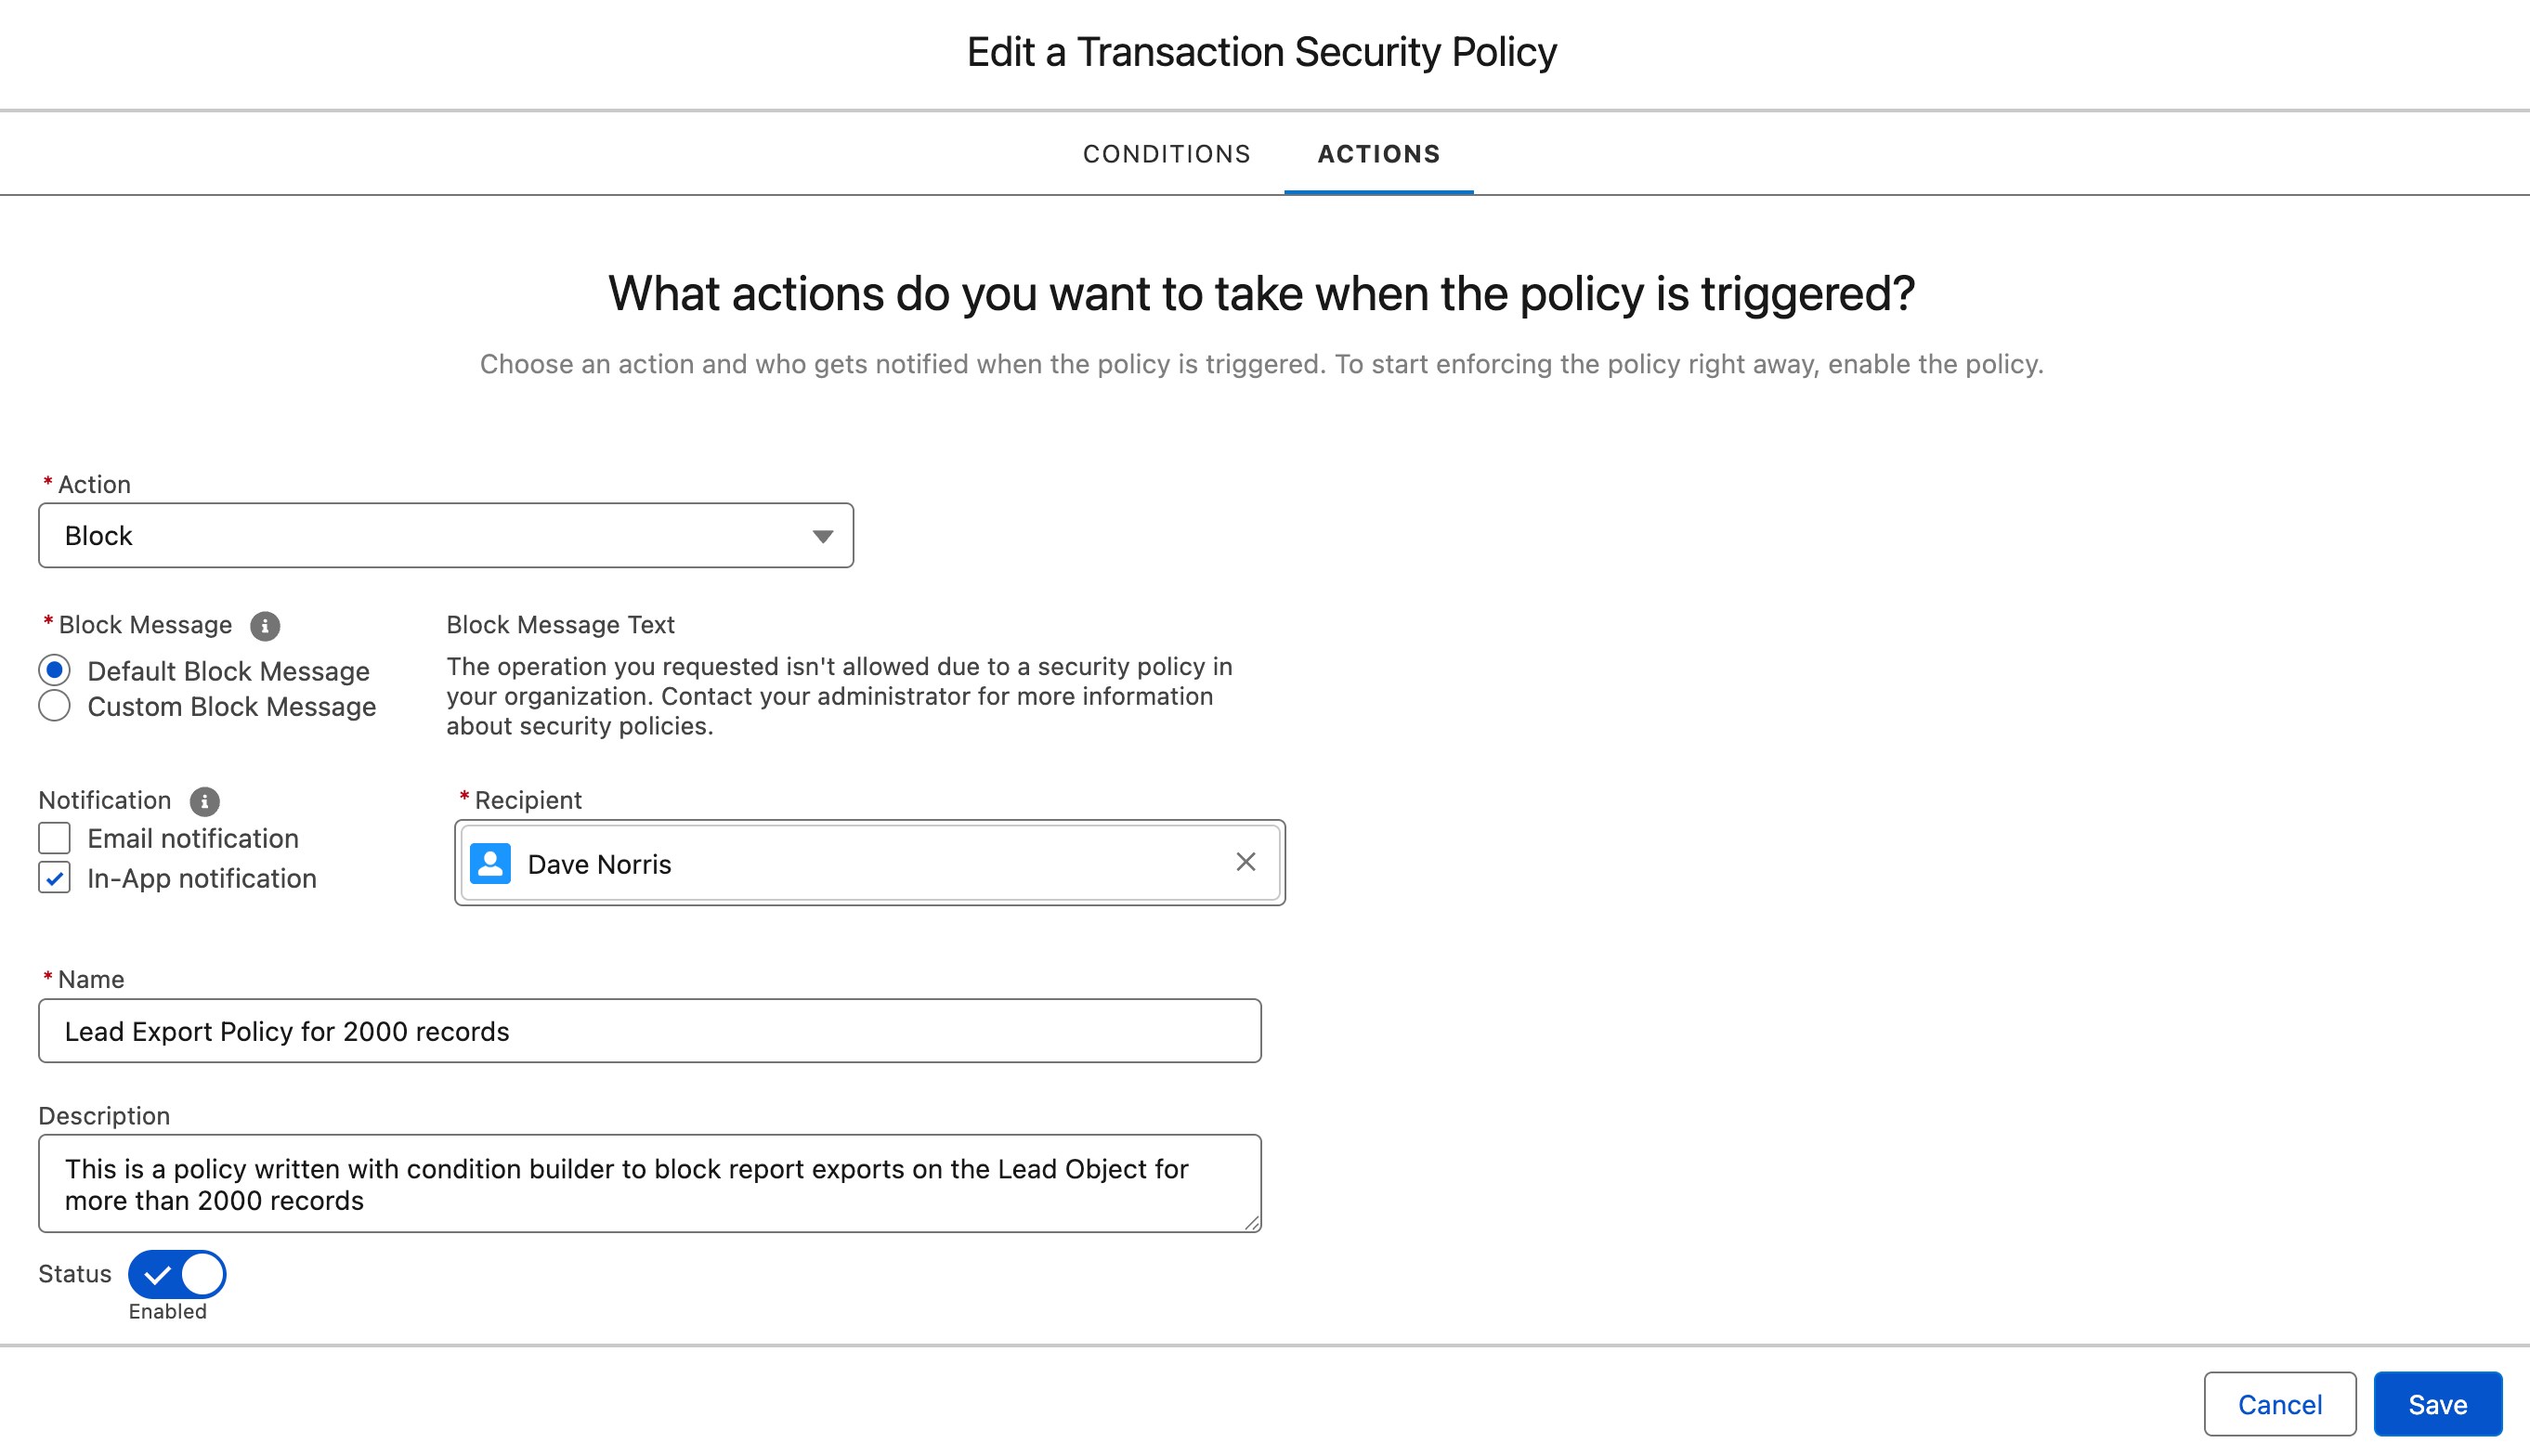
In our example, when a user tries to export a Lead report with more than 2,000 records, the user will receive the error specified in the policy configuration — and in this example, blocked from exporting records.

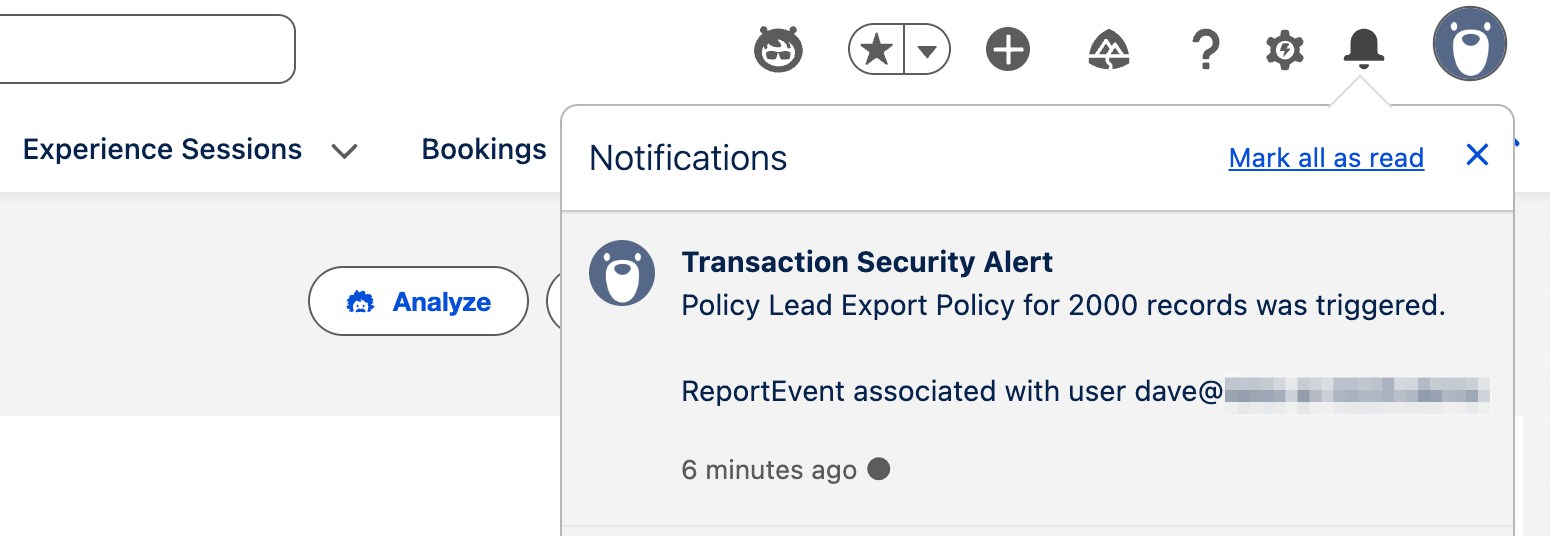
The specified person selected to be the recipient of notifications (typically an administrator or someone in the security team) will receive a corresponding in-app notification.
The Event Storage component
Events processed by the Real-Time Event Monitoring framework can be stored. Two types of Salesforce objects are used:
- Standard Objects are used exclusively for threat detection events due to their low volumes. These events are stored for six months.
- Big Objects are used for all other real-time events where scalable storage is required to support the potential for a high number of event records. Data is retained for six months (10 years for some identity events).
Nineteen events can be put into these objects and represent a solution designed for more scalable storage for large data volumes.
In Setup, the Event Manager page allows an administrator to select which events are stored by toggling the Enable Storage drop-down menu.
A comparative overview of Event Monitoring capabilities*
To assess how each capability of Event Monitoring can support your monitoring strategy, this comparison table shows a summary of key metrics that can help you determine which method to use for different use cases.
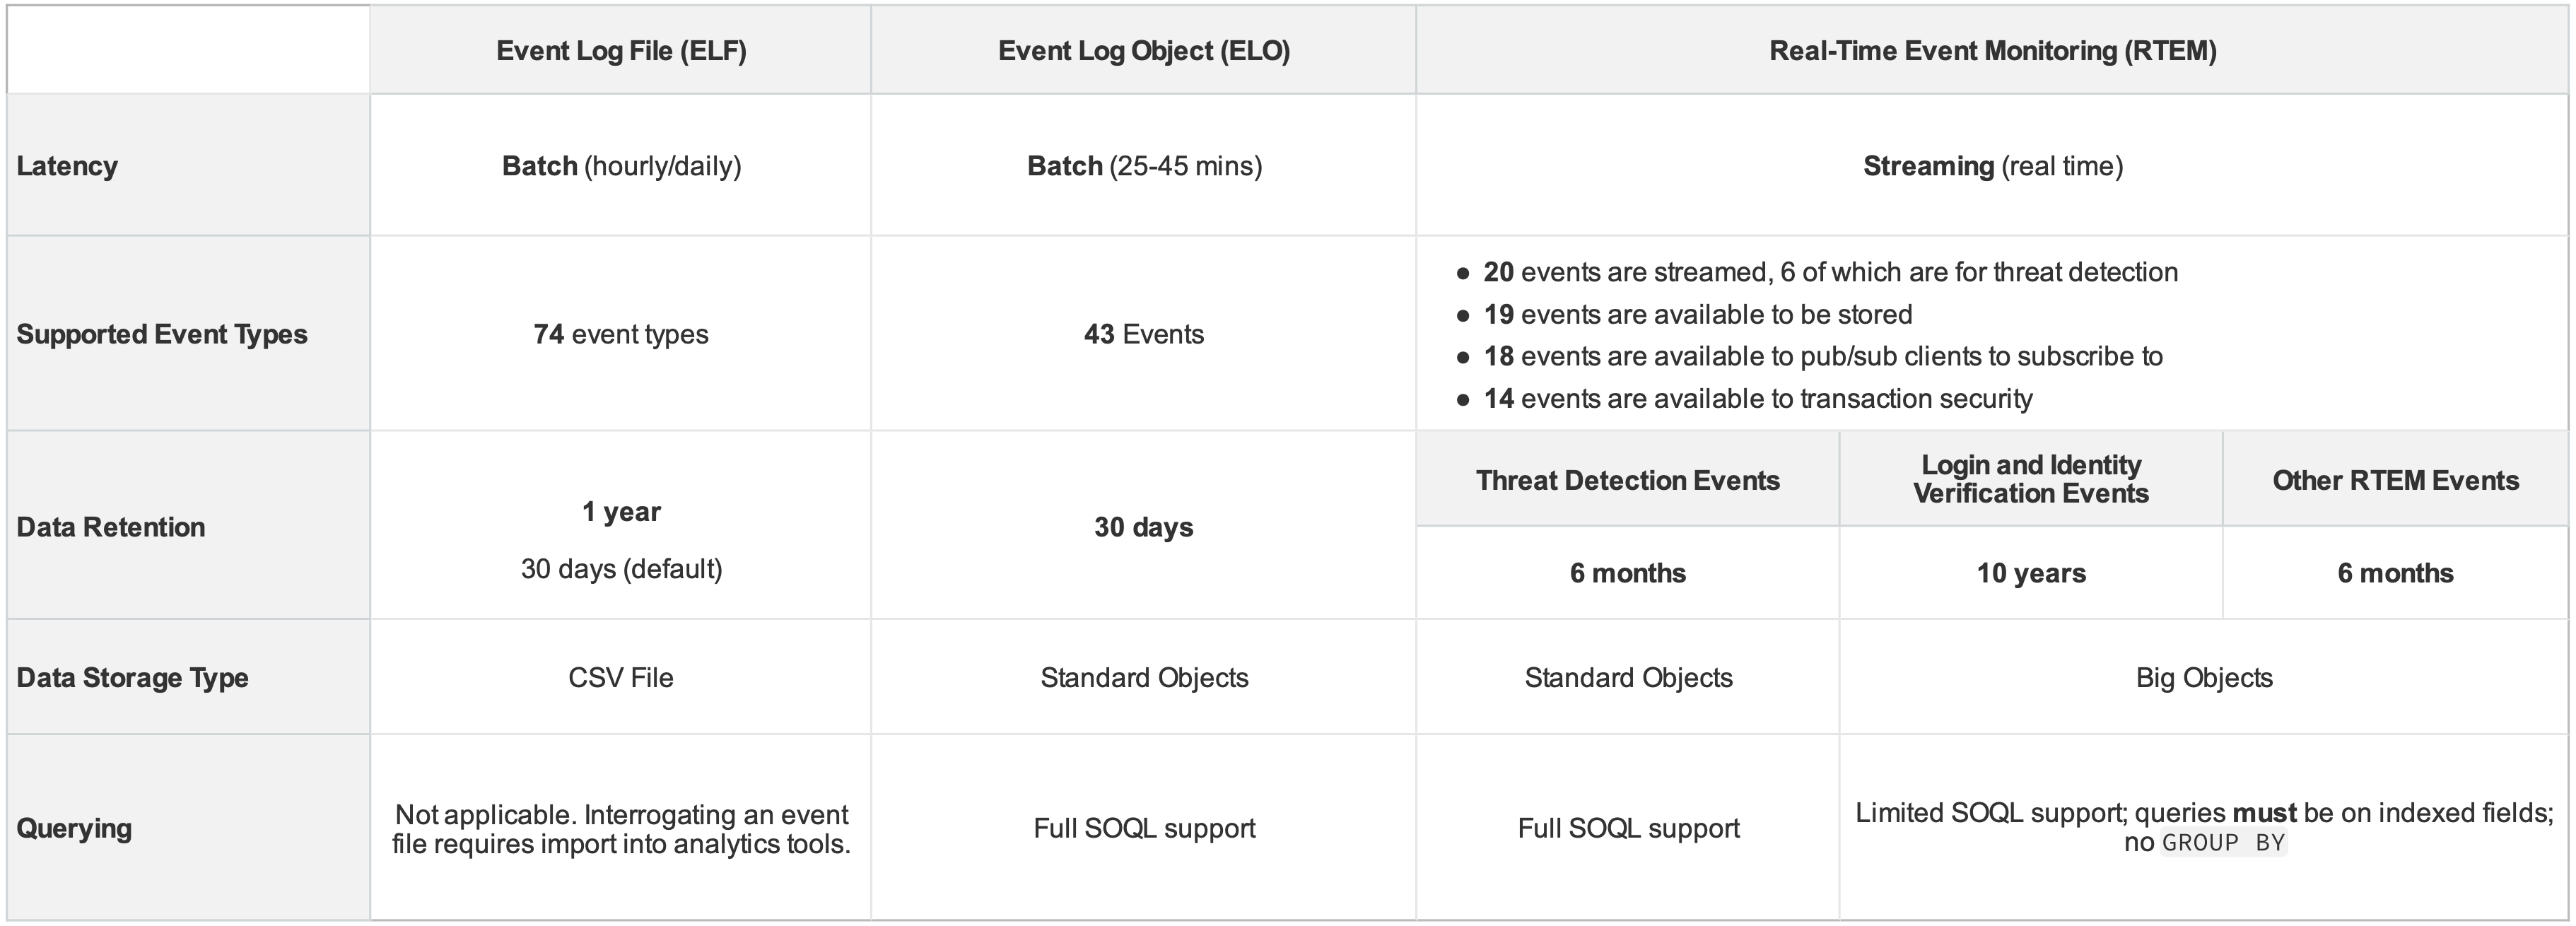
*Enhanced Mobile Application Security events have been omitted for brevity. All other details are correct as of the Winter ’26 release.
Reporting and analytics
Customers need a way to visualize and report on these logs. They can use the Salesforce Platform’s Bulk and REST APIs to retrieve data from the event storage objects, or they can stream available events in real time. CRM Analytics also provides an Event Monitoring Analytics app with pre-built dashboards to start exploring event monitoring data quickly.
Some security information and event monitoring (SIEM) tools can aggregate security logs, and some come with pre-built connectors to extract and stream the data on demand.
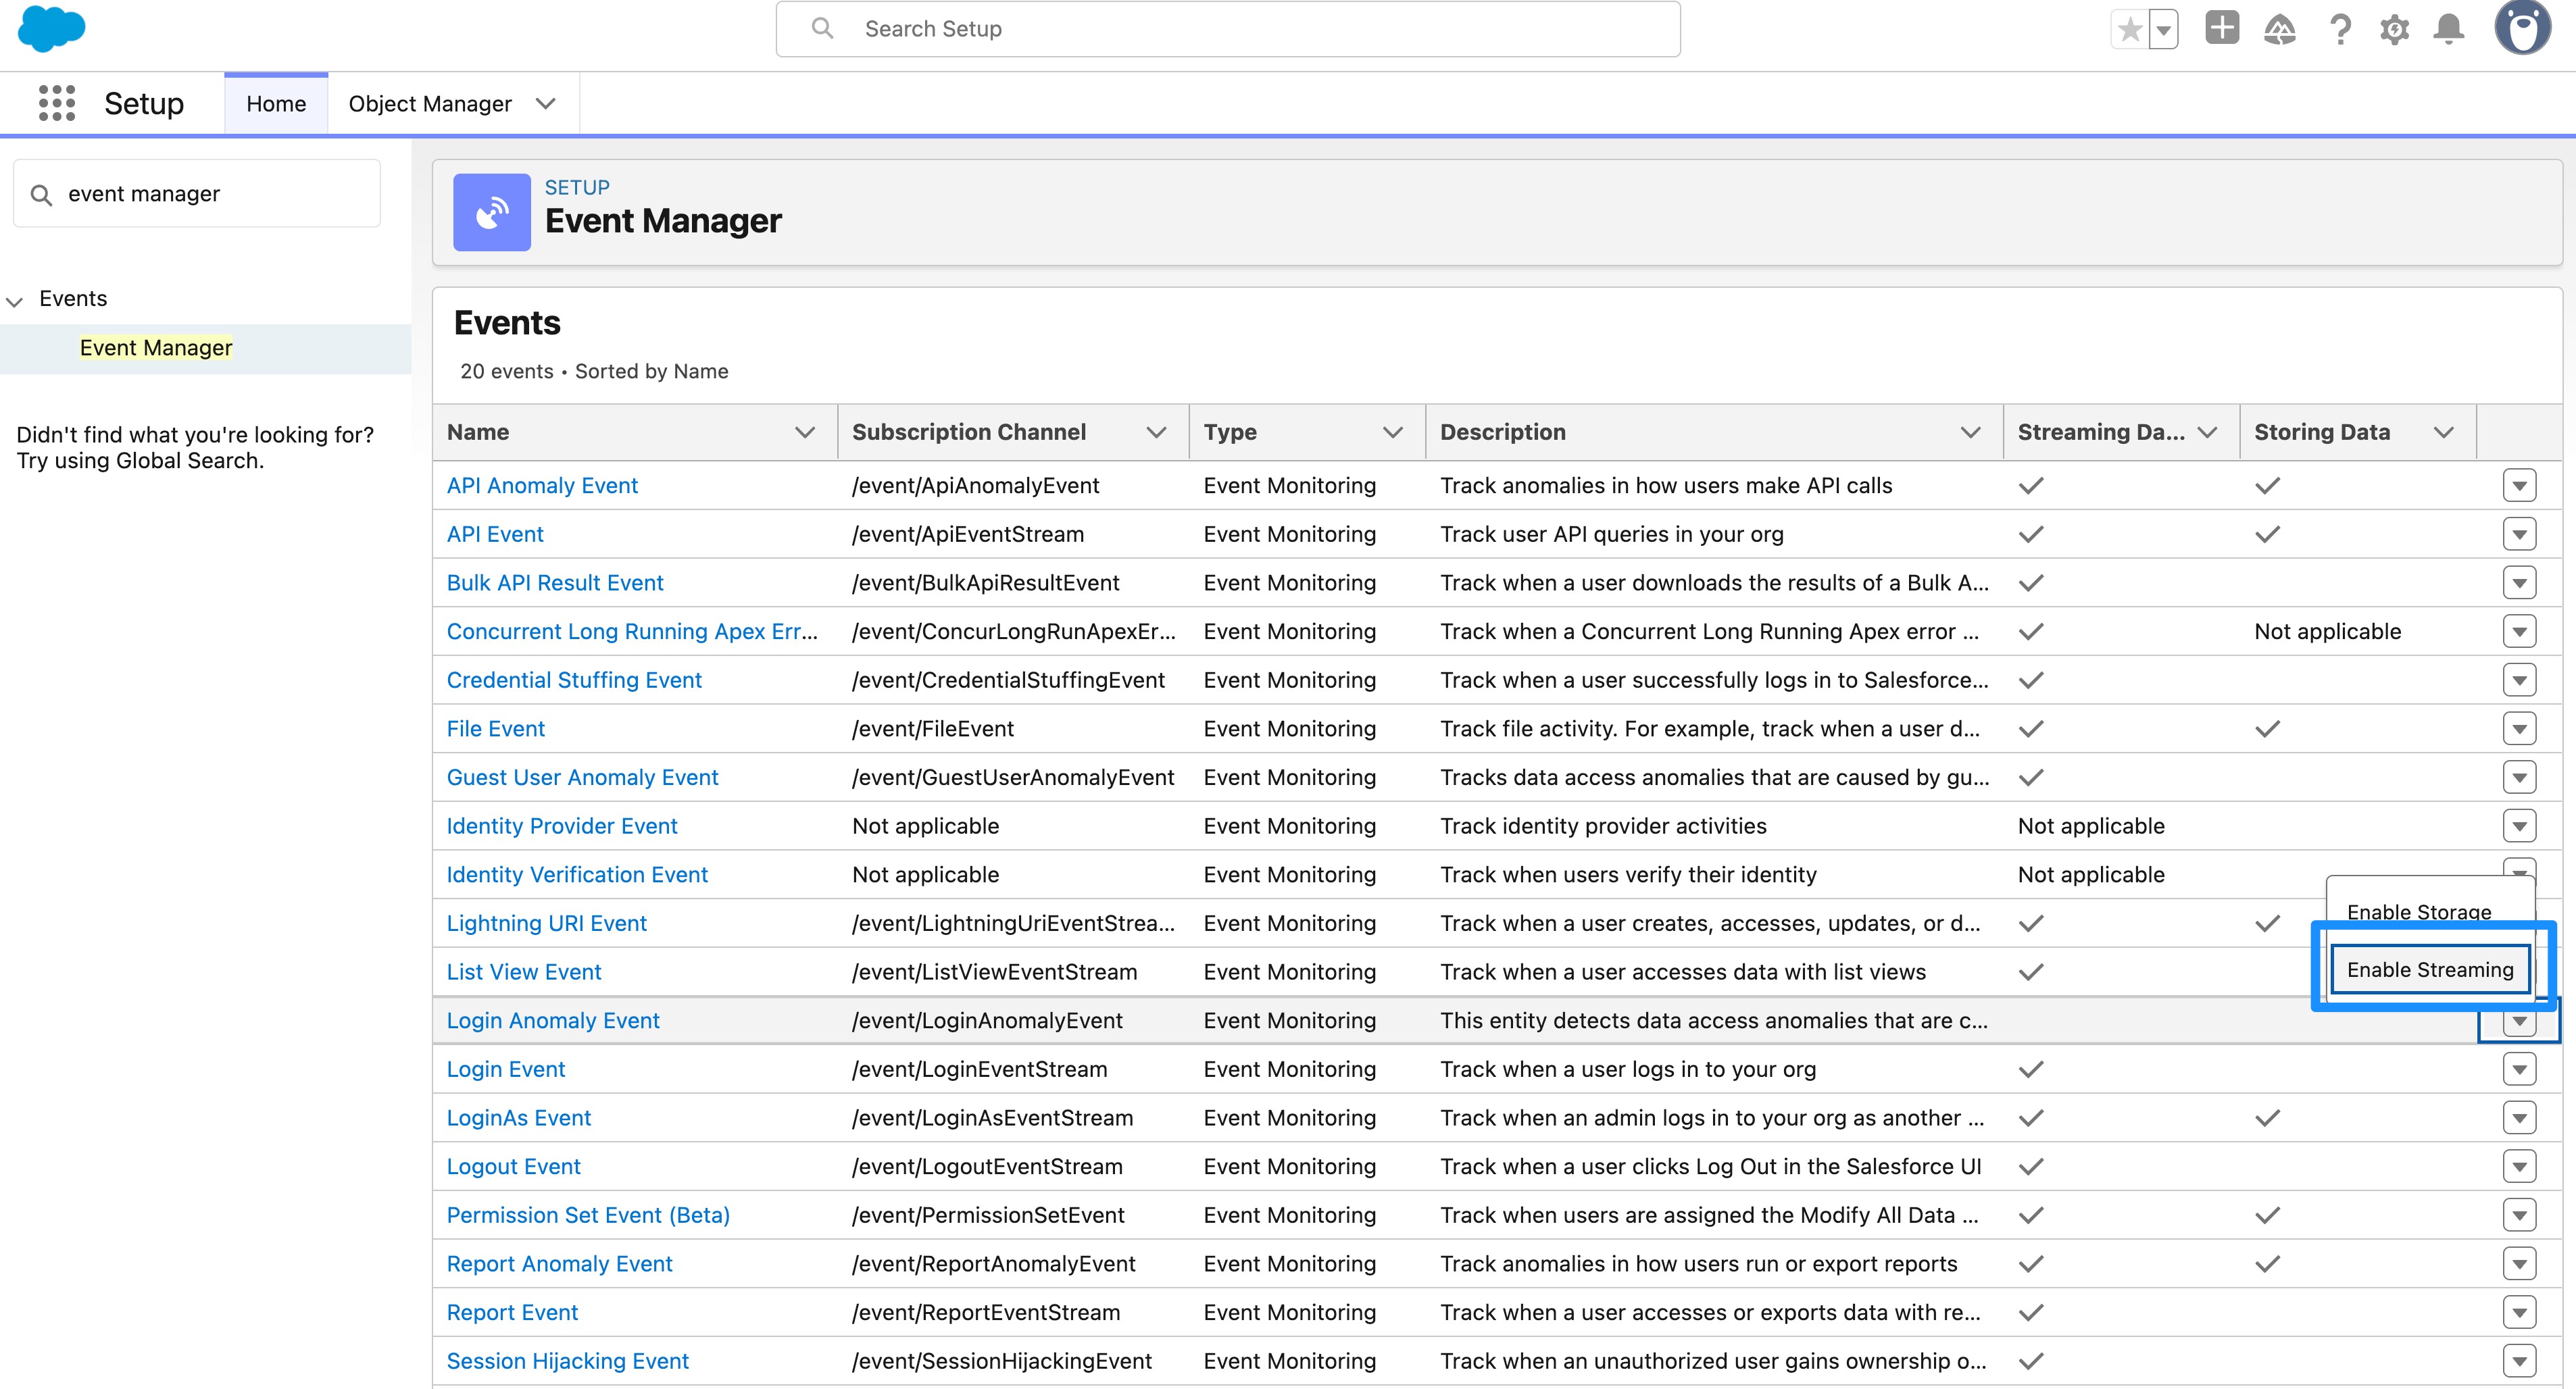
The events streamed from the Real-Time Event Monitoring framework can be subscribed to from an external system of your choice using a Pub/Sub API client. In Setup, the Event Manager page allows an administrator to select which events to stream and the subscription channel that the client should use for each.
The Salesforce Platform Events connector (Beta) lets organizations easily stream event data from Salesforce Real-Time Event Monitoring to Data Cloud. By combining Event Monitoring with Data Cloud, you get a scalable data platform to store large quantities of events for analysis that can now use calculated insights to aggregate data at scale.
How Event Monitoring applies to the Salesforce Well-Architected Framework
The Well-Architected Framework’s pillars provides a lens through which to view Event Monitoring’s value. As an architect, it’s a great way to validate your understanding of key capabilities and provides a great structure for conversations with an enterprise security team. We’ll take a look at each pillar and highlight some key capabilities that align with the features of Event Monitoring, without being an exhaustive list.
Trust Pillar
A solution well-architected to build trust behaves in ways that are secure, compliant, and reliable.
Secure
A secure architecture protects data and controls access. Event Monitoring provides the data necessary to enforce this principle by enabling real-time threat detection and response. Transaction Security applies your company’s policy-driven actions, and event types support the monitoring of user and application access over time.
Salesforce’s native Threat Detection service uses statistical and machine learning models to identify suspicious behavior. This service generates specific events that guard against cyber attacks and suspicious data access.
Transaction Security takes security a step further since it providesa framework that intercepts key events happening in your org and applies your company’s policy-driven actions. This transforms Event Monitoring from a logging tool into an important component of an automated security defense.
You can use a variety of event types to build out this security defense, such as:
Login Event: Records every successful and failed login attemptLogin As Event: Tracks when an administrator logs in as another user, providing an audit trail for privileged accessPermission Update Event: Captures changes to object, field, and user permissions, and set up entities that occur in profiles and permission sets to review Principle of Least Privilege initiativesList View Event: Captures list views accessed by a user with column detailsReport Event: Monitors when a user exports data from a report, providing an event to detect users accessing sensitive informationApex REST API Event: Includes details on payloads being sent into your org and the data that was queried
Compliant
A compliant architecture adheres to legal, ethical, and company-specific policies. Event Monitoring captures detailed logs of user and system activity that are crucial for creating audit trails.
Architects must understand the data retention policies in place. A paid Event Monitoring license provides up to one year of Event Log File data. However, because Event Log File data is not a permanent system of record and can have data gaps (for instance during an org migration), it should not be considered a system of record.
A variety of events support compliance use cases, such as:
Permission Update Event: Detects when a user is assigned critical permissions, providing an auditable records of elevated accessGroup Membership Event: Captures details about changes to public group and queue membership, such as when users are added or removed
Reliable
A reliable Salesforce org operates efficiently and scales with business needs. Event Monitoring provides the objective data required to measure and improve performance, moving beyond anecdotal user complaints like “the app seems slow.”
Events that can support data-driven decisions on performance metrics include:
Concurrent Long-Running Apex Limit Event: Quantifies the potential business impact of when and how often Apex is causing long-running requests to exceed your orgs limitLightning Error Event: Captures information about problems encountered by users while navigating, interacting with components, or performing actions in the Lightning environmentLightning Performance Event: Tracks trends and metrics related to the performance of your Lightning apps, such as page load times and resource usage, to locate performance issues
Easy pillar
A solution well-architected to be easy behaves in ways that are intentional, automated, and engaging.
Intentional
One of my favorite concepts of an intentional architecture is that “features and fixes are prioritized and delivered in ways that are transparent to business and technology stakeholders alike” (view source). By analyzing event logs, architects gain insights into feature adoption and user behavior, fundamentally providing the data needed to drive decisions.
Events that can guide strategic decisions into where issues lie and how they impact the business are:
URI Event: Tracks web clicks, providing objective data on user behavior and adoption of featuresReport Event: Helps understand which reports are being used and which are notList View Event: Shows which list views are being used and which are notDashboard Event: Helps track dashboard usage to quantify technical debt and track performanceApex Execution Event: Tracks how often a new custom feature is being used by looking at Apex used
Automated
A key concept of an automated architecture leverages efficiency to streamline processes. Event Monitoring, particularly with the Real-Time Event Monitoring framework, enables the ability to automate security policies through Transaction Security. These policies can automatically take action to block or enforce MFA when a threat is detected, moving from reactive, manual firefighting to proactive, automated prevention.
With a centralized security information and event monitoring (SIEM) platform, architects and security teams can create sophisticated correlation rules to detect multi-vector attacks and automate alert management. These systems can be configured to prioritize alerts based on severity, enabling security operations teams to focus on the most critical threats and respond more quickly to incidents.
Engaging
A key callout in the engaging aspect of the easy pillar is that the application should “make it easy for people to access and use apps, making users feel they are getting more high-quality work done, and making people want to use apps in the system” (view source). Event Monitoring provides the events needed to measure system engagement over time.
Events that can guide strategic decisions on usability include:
Lightning Logger Event: Allows developers to track when users are interacting with their custom lightning web componentsInvocable Action Event: Provides metrics to monitor actions invoked during Agentforce flows, indicating which agents are used and whenInsufficient Access Event: Addresses a frustrating error for users, allowing the project team to troubleshoot and resolve access issues proactively
Adaptable pillar
A solution well-architected to be adaptable behaves in ways that are resilient and composable.
Resilient
A resilient architecture can return to an ideal state or shape in a predictable way, even in the face of change or failure. Event Monitoring provides insights into changes being made to underlying metadata and permissions, giving insights into when, what, and how a change was applied. When production issues arise, the Real-Time Event Monitoring framework enables continuous monitoring and alerting.
Events that help monitor change over time include:
Metadata API Operation Event: Provides the ability to detect changes to an org’s structure over time, with insights into changes that have impacted business processes adverselyApex Unexpected Exception Event: Enables users to quantify, triage, and resolve issues in production that have slipped through testing with metrics onLimitExceptions
Composable
A composable architecture is built in units that can operate gracefully with one another and can be adjusted quickly. Event Monitoring facilitates this by providing industry-standard access to event logs and objects through APIs. This allows third-party applications to build connectors that can read the standard event payloads to allow Event Monitoring logs to be a composable component in a broader enterprise architecture.
Conclusion
As architects, our reality is not one of perfect, bug-free, blazingly fast, impenetrable applications, but one of continuous vigilance and rapid response. The crises we face — the slow-running reports, the mysterious Apex exceptions, and the unsettling questions about data security — are no longer just challenges; they are opportunities to demonstrate the maturity of our architectures.
Understanding how Event Monitoring works under the hood, and how its capabilities align with the Well-Architected Framework, will equip you with the information needed to get the most out of your monitoring designs. Knowing what is happening across a Salesforce org, in detail, powers the ability to quickly triage issues and make informed decisions. This makes Event Monitoring a vital part of any architect’s toolkit.
Resources
- Trailhead: Event Monitoring
- Documentation: Event Monitoring
- Documentation: Using Event Monitoring
- Documentation: EventLogFile Supported Event Types
- Documentation: Transaction Security Event Types
- Documentation: Best Practices for Writing and Maintaining Transaction Security Policies
- Documentation: Examples of Transaction Security Policies (Condition Builder)
- Documentation: Examples of Transaction Security Policies (Apex)