


As we enter the peak shopping season, consumers are not in a rush to complete their shopping list. The Shopping Index, which analyses the shopping activity of more than 1.5 billion global consumers, shows that discounts were out of favour for retailers globally in Q3 2023, and shoppers took notice.
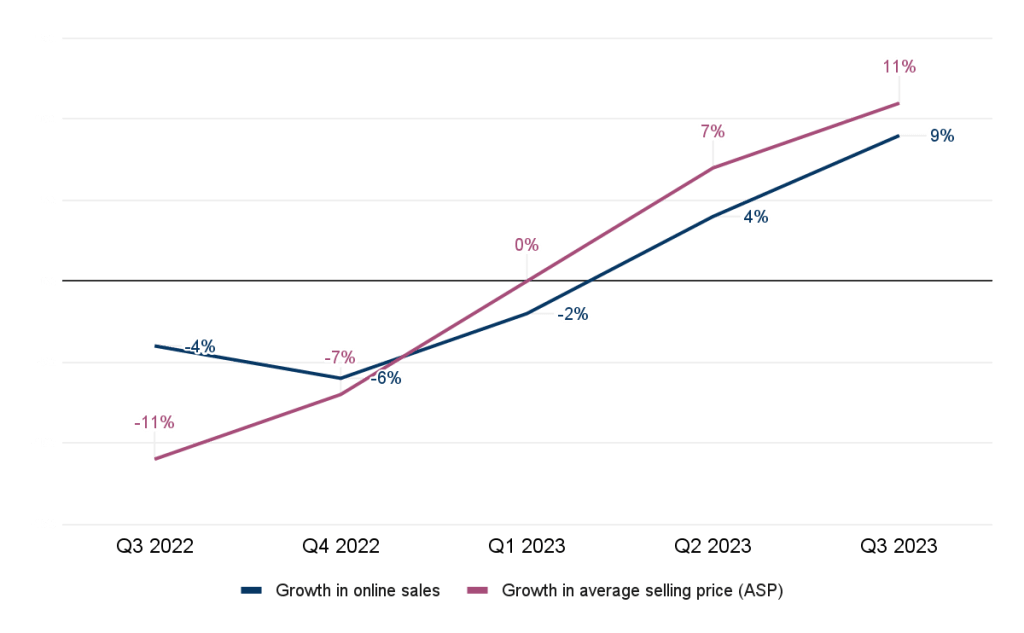
In Europe, the upward trend continued with online sales growing 9% and traffic up 4% year-on-year (YoY) in Q3. There’s more good news: shoppers in the region bought more items per transaction, which translated into a 2% growth in units per transaction (UPT), though they shopped less often — order volume declined by 3%.
In terms of the categories that saw the most growth: general handbags (+30%), active footwear (+29%), general footwear (+28%) and home dining (+27%), were the top performers. While, electronics & accessories (-8%) stood alone as the only category with a decline in Q3 online sales across Europe.
As retailers strive to protect their margins by finding other creative ways besides deep discounts to entice customers, the Q3 average discount rate in Europe stood at 16% — representing a 6% YoY decline and the biggest pull-back across all regions worldwide. That, in turn, meant that growth in online sales in Europe was predominantly driven by higher prices – showing seemingly unrelenting inflation.
Higher Prices Driving Growth in Online Sales
Shoppers are Starting to Spending More…in Some Countries
Spain (+22%), Eastern Europe (+18%), Italy (+17%) and France (+16%) were the top performers in terms of online sales growth – this largely represents both increased prices and increased purchases in Q3, so we are seeing a glimmer of a rise in demand.
In Spain, traffic grew 8% and orders increased by a healthy 13%, though UPT declined slightly (-3%) — consumers in the country, despite higher prices, shopped more frequently albeit with somewhat fewer items in their basket. The trend was the same in Italy and France, where UPT was slightly down but order volumes grew at a decent pace (10% and 7% respectively).
And then there’s Eastern Europe. Digital traffic there rose by 17%, order volume increased by 5%, and UPT grew by 9%. Despite a 9% drop in the average discount rate, ASP in Eastern Europe declined by 11%, making it one of only two places across Europe with lower prices compared to last year (the other was the Nordics). Indeed, consumers in Eastern Europe are certainly opening up their wallets, as inflation continues to fall sharply.
The UK and Germany Have Turned Positive
The UK and Germany saw positive growth in Q3, much like they did in Q2, following several quarters of decline before that. That said, growth in both countries was mostly driven by higher prices.
In Germany, online sales grew 7%, though both traffic (-1%) and orders (-11%) were down. At 17%, the average discount rate in Germany was 4% lower than it was the previous year. Meanwhile, ASP increased by a notable 22% in the quarter.
Similarly in the UK where ASP grew 11%, digital sales and traffic increased by 7% and 2% respectively, while order volume was down 5%. Additionally, the average discount rate was 12%, which represents an 8% decline over last year.
Takeaway
As we head into the peak shopping season and retailers begin to offer attractive discounts, we expect the positive trend in online sales over the last few quarters across Europe to continue, as shoppers take advantage of bargains. In fact, we predict that 25% of all digital sales, globally, will occur during Cyber Week.
Methodology
Powered by Salesforce platform data, the Shopping Index uncovers the true shopping story. We look at the previous nine quarters to uncover a deep understanding of how consumer behaviour is evolving and how the market is moving. The Shopping Index analyses the activity and online shopping statistics of more than 1.5 billion unique global shoppers from more than 67 countries. This battery of benchmarks covers both the recent history and current state of digital commerce. Several factors are applied to extrapolate macroeconomic figures for the broader retail industry, and these results are not indicative of Salesforce performance.