Your Agents Are Getting More Capable. Is Your Observability Tooling Keeping Up?



Context-based session scoring and multi-agent traces bring new depth to Agentforce Observability, now included for free for every Agentforce customer.


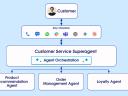
Enterprise AI has come a long way from one-off prompts and agentic pilots. A production agent today might route a customer request through a team of specialized subagents, retrieve context from multiple knowledge sources, execute a workflow, and hand back a response all within a single session. The complexity of what happens inside that session has grown significantly from the first wave of single-turn FAQ agents, and it keeps growing as teams expand what their agents are responsible for.
While agents have advanced by leaps and bounds, most teams’ observability stacks haven’t kept pace. Performance metrics such as escalation, deflection and abandonment rates typically measure proxy signals rather than the ground truth: a customer typing “thank you” might count as a deflection whether the agent resolved their issue or not.
That gap compounds as agents take on more complex work. The more an agent coordinates with other agents, reasons across knowledge sources, and handles requests where context drives the right answer, the more a surface-level signal fails to tell you what you need to know. To help close that gap, we’re updating Agentforce Observability with deeper session context, richer analytics, and more ways to understand what your agents are actually doing. And to make it more accessible than ever, we’re including Observability at no additional Data Cloud cost for all Agentforce customers.
The shift from signal to context
As agents grow increasingly sophisticated, it’s not enough to measure them solely on what happens inside a chat window or on a phone call. To get an accurate picture of how they perform in the real world, key metrics need to incorporate session and conversation data, reasoning traces and other signals and context.
The shift to context-based measurement is the major theme of this release. Session outcome metrics such as deflection and abandonment are moving from signal-based calculation to context-based evaluation. Rather than inferring an outcome from surface-level interaction signals, an LLM now evaluates the full session, using an editable prompt for each metric. Customers can inspect the prompt driving that judgment and edit it to match their own definition of success. The same applies to quality scores, where we’ve made the underlying prompt editable. Teams can go further and define custom LLM-as-judge scores around any dimension that matters to their business: sentiment, tone, competitive mentions, product interest, pricing signals.
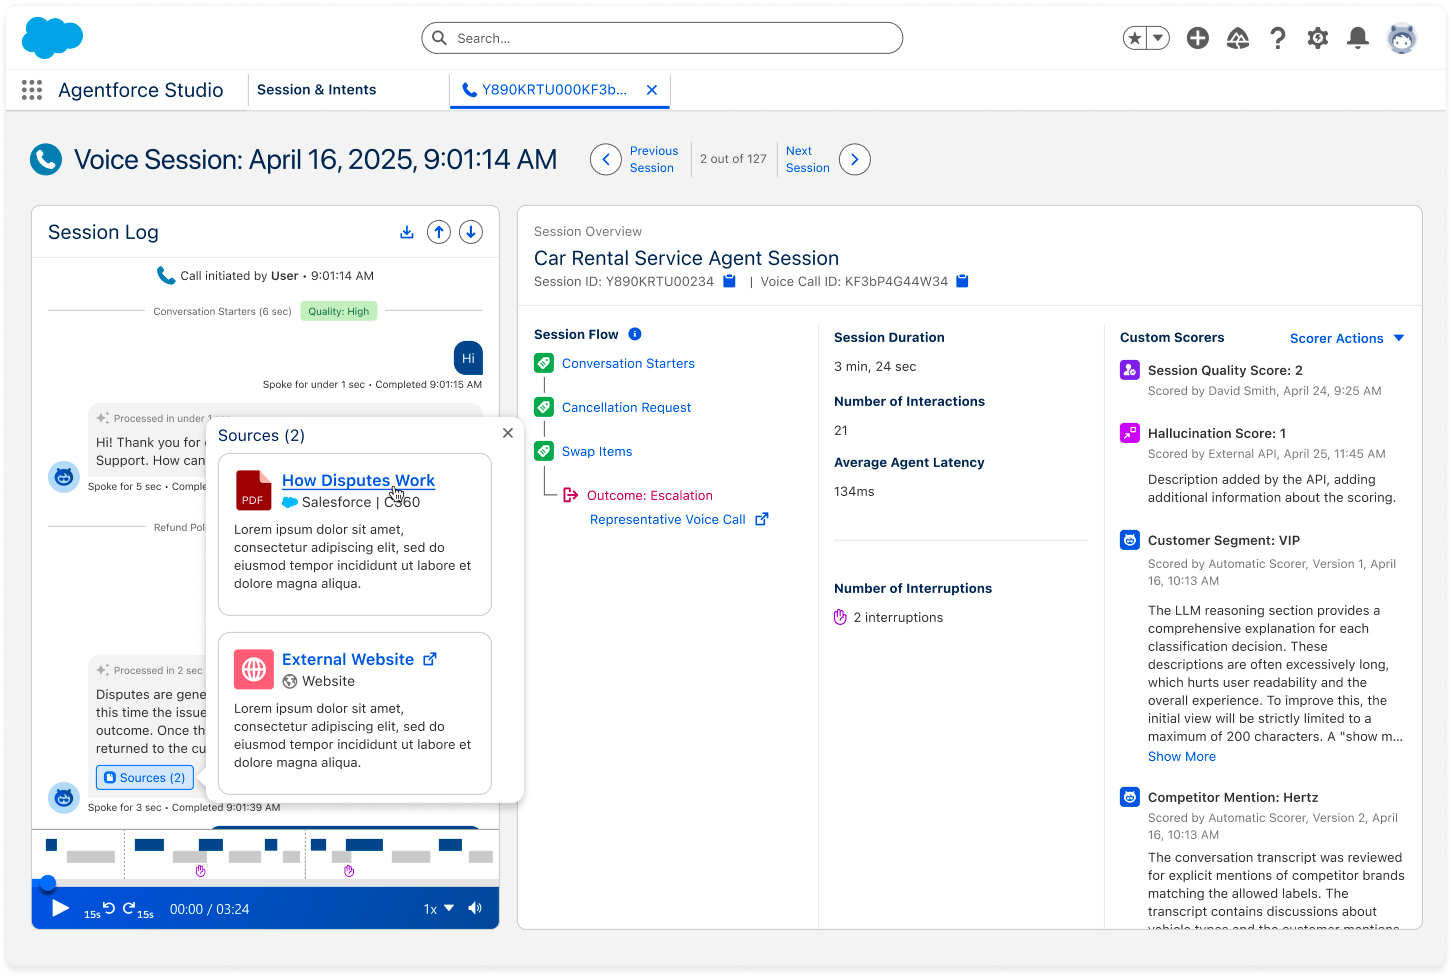
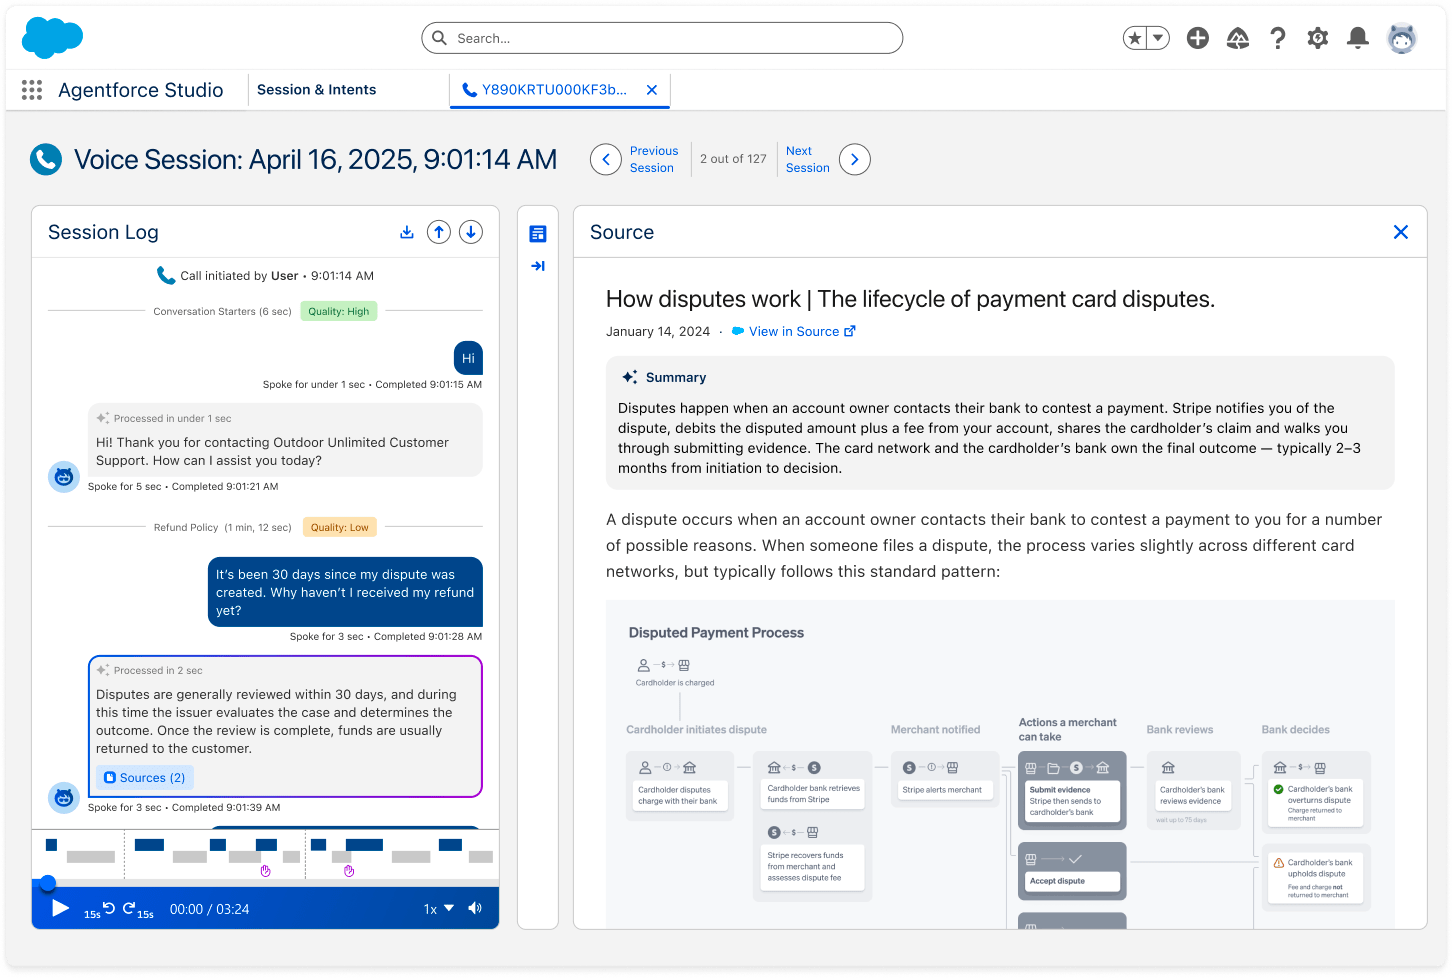
Beginning in August, citations will appear inline in the session view with the specific retrieved chunk highlighted in the source document, whether it comes from a Salesforce knowledge article, a Confluence page or a Google Drive file. This allows human reviewers to quickly see where responses are coming from. Errors appear directly in the session flow so you can see not just that something failed, but exactly where in the reasoning path it happened. For teams running multi-agent workflows, a waterfall trace maps execution across the full chain. If an agent delegates to a subagent, the trace follows it. A graph view lets you toggle into a full debuggability mode with trust and RAG metrics at the interaction level. Session downloads now support bulk selection, and custom table configurations can be saved for repeated use.
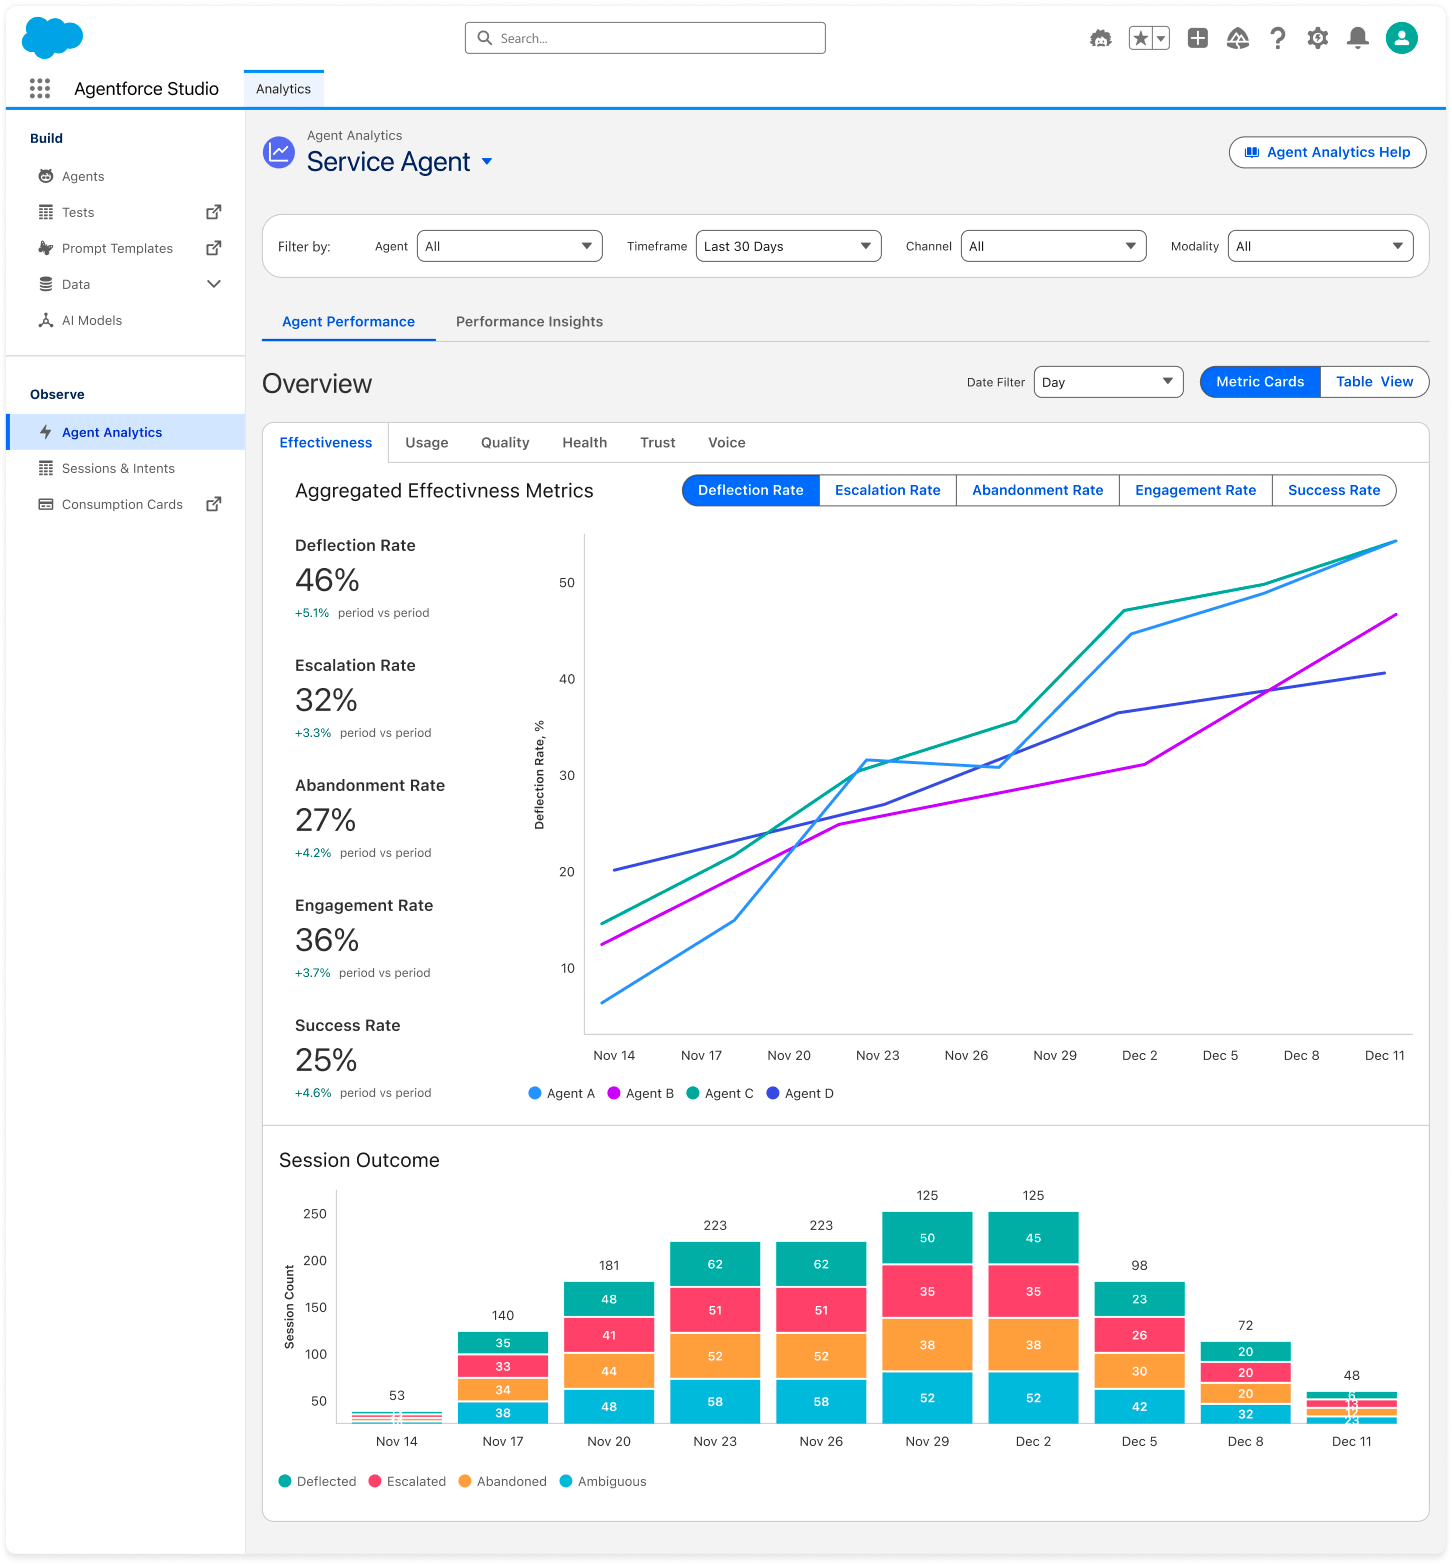
The dashboard has also been rebuilt. Trust, RAG, health and quality metrics that previously lived in separate dashboards are now consolidated in one view, with the ability to pick whichever metric you want and slice the data across subagents, actions and intents. Teams running voice agents get a dedicated surface for voice-specific sessions. Custom dashboards are supported and viewable directly within Observability.
Powering all of this is the Session Tracing Data Model (STDM), which structures every logged event in a session down to a single conversation turn, capturing user input, planner decisions, prompt and action flows, gateway inputs and outputs, errors and final output. Without it, session data arrives as raw JSON that teams have to transform before building any reporting. STDM defines the sessions, interactions and steps so that analytics and alerts build directly from structured tables.
Observability without the meter
Agentforce Observability is now unmetered for every customer across all Agentforce SKUs. The change covers the full observability stack: session tracing and telemetry data ingestion, the metrics and aggregations that power health and performance dashboards, and all out-of-the-box dashboard queries and visualizations. Every drill-down, alert evaluation, and session trace now runs at no additional Data Cloud cost. Usage will still appear in Digital Wallet, but no longer counts against flex credits.
What remains metered is net-new customization: building new dashboards, ingesting external data sources (such as connecting to Snowflake to personalize agent responses or perform segmentation), or creating new objects at the semantic data model level. Modifying or extending existing out-of-the-box dashboards stays unmetered.
Teams that previously limited dashboard access to one or two people can now give every builder, ops owner and stakeholder a direct view of what their agents are doing in production. That changes the feedback loop. Builders can see where sessions are failing, trace them to specific intents, and adjust. Downstream stakeholders can then validate whether the adjustments worked.
All of this is now included with your Agentforce purchase. If you’re running agents in production and haven’t been monitoring them closely, now’s the time to start. Learn more here.