


One of the biggest adjustments to our new normal is the way we shop. As American consumers began following stay-at-home orders in response to the health crisis, they quickly adapted to a mostly digital world. The result? Spending on essential goods through digital channels increased by 60%. Digital commerce as a whole grew by 20% in the first quarter of 2020, compared to the same quarter in 2019, according to the Q1 Shopping Index.
The Salesforce Q1 Shopping Index, powered by Commerce Cloud, analyzes data from the activity of more than one billion global shoppers and shows a dramatic shift from physical to digital browsing and buying.
While many digital shopping behaviors were consistent across the country, we detected several key differences, especially between urban and suburban areas. Our prediction: This pandemic is accelerating trends that were bound to happen eventually.
How U.S. shoppers in different cities and states vary
The stay-at-home orders largely followed the trajectory of the virus, starting in states like Washington and California. As more states put restrictions in place, similarities in digital shopping behaviors emerged across geographies. One thing was clear, as brick and mortar stores closed across the country, daily digital spend accelerated across all corners of the U.S. As mid-March approached, consumers in smaller cities ramped up their daily spending through digital channels. Between mid-March and the end of the month, consumers increased their daily digital purchases by 50%. Meanwhile, daily digital spend from the country’s largest cities grew by 56% over the same period.
To understand these changing behaviors, we analyzed shopping behavior by region across the U.S. Here’s what we found:
- The top U.S. metros for digital commerce in Q1 were New York, Boston, and Chicago, respectively.
- East Coast shoppers spent 200% more on digital purchases than their West Coast peers.
- Colorado residents were the most likely to purchase essentials online in March, accounting for 24% of their March digital spending.
- Oregon residents were least likely to purchase essentials online in March, representing only 6% of digital spend that month.
- States that enacted stay-at-home orders in March saw big surges in digital revenue afterward:
- New York: 49% of March’s revenue came after the stay at home order (March 19)
- Illinois: 43% of March’s revenue came after the stay at home order (March 21)
- New Jersey: 43% of March’s revenue came after the stay at home order (March 21)
- Mobile shopping:
- Highest rate of mobile traffic: Michigan and Mississippi (77% mobile traffic share)
- Highest rate of mobile orders: Missouri (62% mobile order share)
- Lowest rate of mobile traffic: Wyoming (39% mobile traffic share)
- Lowest rate of mobile orders: Vermont (39% mobile order share)
For the first time in three years, shoppers across the U.S spent more money per day through digital channels by the end of March. (see image below)
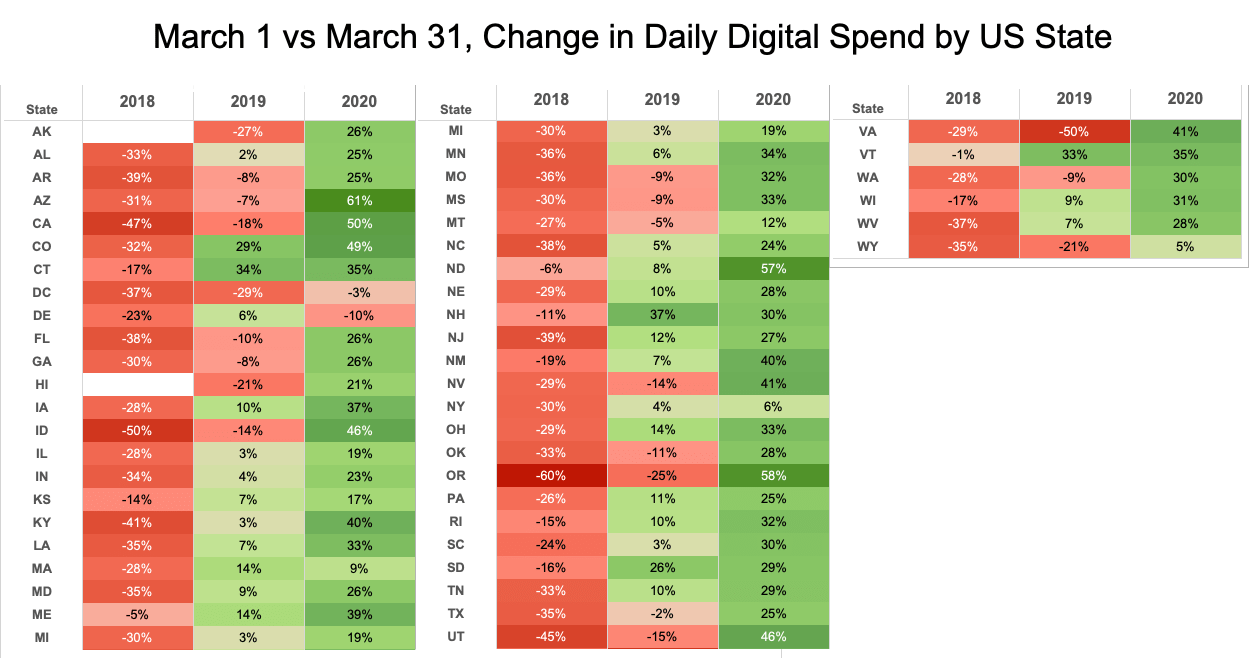
Click image to view in a new window
As a result, we recommend retailers revisit their segmentation strategies, paid media targets, and product recommendations. Artificial Intelligence (AI) and predictive analytics can help retailers rapidly adjust those strategies, find the best audiences, and segment based on different sets of attributes, including geography. AI also analyzes actions to predict how audiences will respond to messaging. Learn more about how to create smart segmentation strategies here. Has your organization already implemented AI? Learn how to adjust your AI strategy for volatility.
Priorities, behaviors across the U.S. have changed
Regardless of the differences in regional shopping behaviors, one thing is clear: Priorities have changed. Before the pandemic, consumers browsed and made purchases online during commuting or evening hours. Peak orders happened between 7:00 p.m. and 9:00 p.m. With the absence of a commute and a clear delineation between work and home, consumers have shifted their browsing and buying habits to midday hours. Now, digital orders are peaking between 9:00 a.m. and 1:00 p.m.
But the lines between work and home aren’t the only aspects of our lives becoming blurred. Do you have a hard time remembering what day of the week it is recently? You’re not alone. Before the pandemic, consumers tended to alter their browsing and buying habits between weekdays and weekends. These days there are fewer differences in shopping behavior between weekdays and weekends:


Consumers are prioritizing their evenings for family dinner and activities and saving the bulk of their commerce activities for working hours. Brands must adjust to these new routines, lead with values, and reach consumers at the right time. Brands like Fender and Glossier are doing so by offering new digital experiences, free guitar lessons, and sample make-up routines, respectively, to customers stuck at home.
Top five searches by metro during lockdown
These days it’s all about the basics. We analyzed search trends across the U.S., and it was apparent that our interests can unite us. One search term made it into most major metro’s top five list: Disney. With parents working from home and kids out of school, undoubtedly, consumers were searching for products that would keep their children engaged. Another surprise? Most shoppers were daydreaming about the summer as “dresses” made the top five list among many cities.
But there are differences, too. For example, consumers in Chicago are looking to upgrade their living spaces with a new sofa. Meanwhile, New York City shoppers are craving some luxury as “Gucci” topped their top five most searched terms. Find out what your consumers are searching for in the chart below:

Social traffic and orders have also increased as consumers use social media as their primary form of connection. In the U.S., Q1 digital traffic referred from social channels grew by 47%. That growth was even higher from traffic referred by a mobile device, increasing 56% over the previous year. Meanwhile, orders from social channels also surged, growing by 57% overall, and 68% from mobile devices. As shoppers rely on their social channels to connect, the lines between socializing and commerce will continue to blur.

Successful retailers will adopt social listening and contribute to conversations where your product or services are relevant — ensuring to maintain a humble and helpful tone. If customers are shopping via social, guide them as they make their purchase decisions with social selling best practices.
Adjusting to a “new normal”
The shift to digital commerce as non-essential stores shuttered was both quick and dramatic. Americans living in hard-hit areas like New York City and Chicago relied on ecommerce the most. But the reality is that consumers across the country are turning to digital in records numbers to complete purchases for the most basic necessities.
To keep up with consumer needs in this unprecedented time, try free resources like Quip or Salesforce Care for Commerce Communications as you develop new work-from-home processes. Also, access free online guidance for keeping it together despite the crisis.
To learn more about the changing habits of American shoppers along with those in other countries in the face of the pandemic, visit the Tableau public dashboard that merges publicly available COVID-19 data with Salesforce Shopping Index data.
Subscribe to our blog newsletter to get the latest in Leading Through Change.
Q1 Shopping Index Methodology
The Q1 Shopping Index uncovers the true shopping story through analyzing the activity of more than one billion shoppers across more than 34 countries powered by Commerce Cloud, with a focus on 10 key markets: U.S., Canada, U.K., Germany, France, Spain, Japan, Netherlands, Australia/New Zealand, and the Nordics. This battery of benchmarks provides a deep look into the last nine quarters and the current state of digital commerce. Several factors are applied to extrapolate actuals for the broader retail industry and these results are not indicative of Salesforce performance.